Lev1: ARTISANAL AND SMALL SCALE MINING ASM//ARTISANAL MINING//SMALL SCALE MINING - Statistics for Countries |
Statistics per Country |
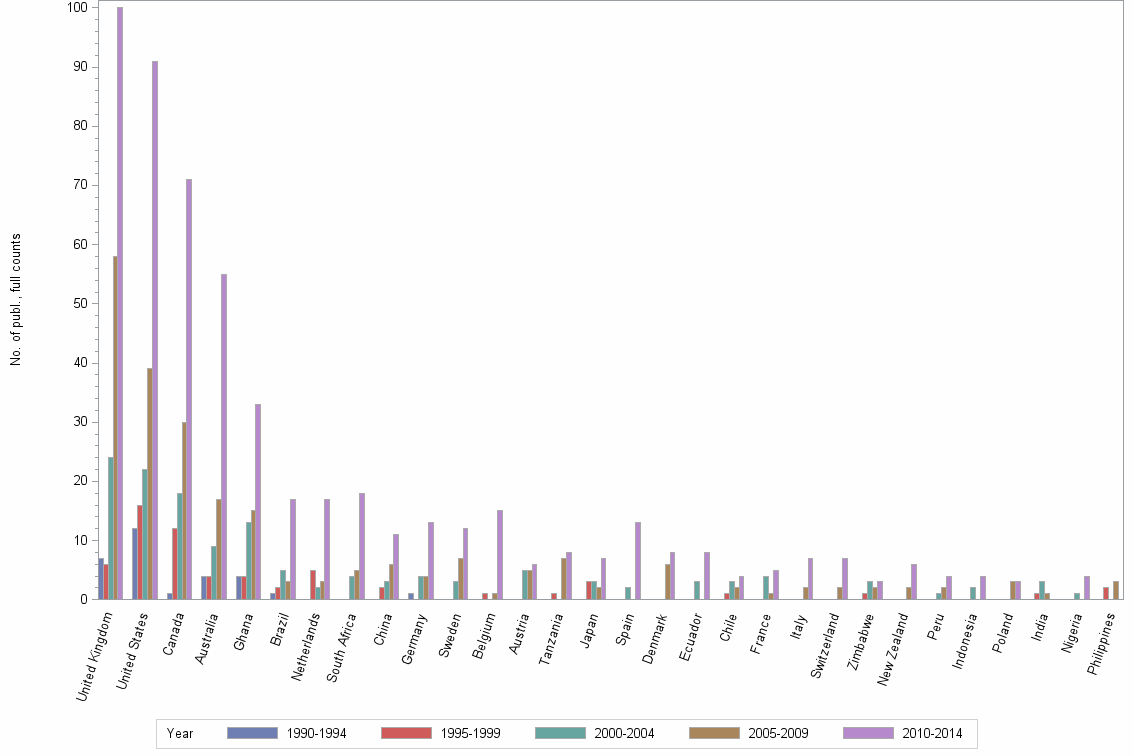
Number of publications, full counts |
| Obs | Country | 1990-1994 | 1995-1999 | 2000-2004 | 2005-2009 | 2010-2014 | All years |
|---|---|---|---|---|---|---|---|
| 1 | All countries | 38 | 65 | 117 | 191 | 445 | 856 |
| 2 | United Kingdom | 7 | 6 | 24 | 58 | 100 | 195 |
| 3 | United States | 12 | 16 | 22 | 39 | 91 | 180 |
| 4 | Canada | 1 | 12 | 18 | 30 | 71 | 132 |
| 5 | Australia | 4 | 4 | 9 | 17 | 55 | 89 |
| 6 | Ghana | 4 | 4 | 13 | 15 | 33 | 69 |
| 7 | Brazil | 1 | 2 | 5 | 3 | 17 | 28 |
| 8 | Netherlands | . | 5 | 2 | 3 | 17 | 27 |
| 9 | South Africa | . | . | 4 | 5 | 18 | 27 |
| 10 | China | . | 2 | 3 | 6 | 11 | 22 |
| 11 | Germany | 1 | . | 4 | 4 | 13 | 22 |
| 12 | Sweden | . | . | 3 | 7 | 12 | 22 |
| 13 | Belgium | . | 1 | . | 1 | 15 | 17 |
| 14 | Austria | . | . | 5 | 5 | 6 | 16 |
| 15 | Tanzania | . | 1 | . | 7 | 8 | 16 |
| 16 | Japan | . | 3 | 3 | 2 | 7 | 15 |
| 17 | Spain | . | . | 2 | . | 13 | 15 |
| 18 | Denmark | . | . | . | 6 | 8 | 14 |
| 19 | Ecuador | . | . | 3 | . | 8 | 11 |
| 20 | Chile | . | 1 | 3 | 2 | 4 | 10 |
| 21 | France | . | . | 4 | 1 | 5 | 10 |
| 22 | Italy | . | . | . | 2 | 7 | 9 |
| 23 | Switzerland | . | . | . | 2 | 7 | 9 |
| 24 | Zimbabwe | . | 1 | 3 | 2 | 3 | 9 |
| 25 | New Zealand | . | . | . | 2 | 6 | 8 |
| 26 | Peru | . | . | 1 | 2 | 4 | 7 |
| 27 | Indonesia | . | . | 2 | . | 4 | 6 |
| 28 | Poland | . | . | . | 3 | 3 | 6 |
| 29 | India | . | 1 | 3 | 1 | . | 5 |
| 30 | Nigeria | . | . | 1 | . | 4 | 5 |
| 31 | Philippines | . | 2 | . | 3 | . | 5 |
| 32 | Colombia | . | . | . | . | 4 | 4 |
| 33 | Norway | . | . | . | 1 | 3 | 4 |
| 34 | Argentina | . | . | . | . | 3 | 3 |
| 35 | Czech Republic | . | . | . | 1 | 2 | 3 |
| 36 | Greece | . | . | . | 1 | 2 | 3 |
| 37 | Kenya | . | . | . | . | 3 | 3 |
| 38 | Mozambique | . | . | . | 1 | 2 | 3 |
| 39 | Romania | . | . | . | 1 | 2 | 3 |
| 40 | Suriname | . | 1 | . | 1 | 1 | 3 |
| 41 | Bolivia | . | . | . | 1 | 1 | 2 |
| 42 | Burkina Faso | . | 1 | . | . | 1 | 2 |
| 43 | Ethiopia | 1 | . | . | 1 | . | 2 |
| 44 | Guyana | . | . | 1 | . | 1 | 2 |
| 45 | Mexico | . | . | 1 | 1 | . | 2 |
| 46 | Turkey | . | . | 1 | . | 1 | 2 |
| 47 | Bangladesh | . | . | . | . | 1 | 1 |
| 48 | Brunei | . | . | . | . | 1 | 1 |
| 49 | Cameroon | . | . | . | . | 1 | 1 |
| 50 | Fiji | . | . | . | 1 | . | 1 |
| 51 | Finland | . | . | . | . | 1 | 1 |
| 52 | Ireland | . | . | . | 1 | . | 1 |
| 53 | Kazakhstan | . | . | . | . | 1 | 1 |
| 54 | Korea, Republic of | . | . | . | . | 1 | 1 |
| 55 | Kyrgyz Republic | . | . | . | 1 | . | 1 |
| 56 | Mongolia | . | . | . | . | 1 | 1 |
| 57 | Niger | . | . | . | . | 1 | 1 |
| 58 | Papua New Guinea | . | . | . | . | 1 | 1 |
| 59 | Paraguay | . | 1 | . | . | . | 1 |
| 60 | Russian Federation | . | . | . | . | 1 | 1 |
| 61 | Senegal | . | . | . | . | 1 | 1 |
| 62 | Sierra Leone | . | . | . | 1 | . | 1 |
| 63 | Slovak Republic | . | . | . | 1 | . | 1 |
| 64 | Slovenia | . | . | . | . | 1 | 1 |
| 65 | Uganda | . | . | . | . | 1 | 1 |
| 66 | Zambia | . | . | 1 | . | . | 1 |
Number of publications, full counts |