Lev1: ATLANTIS II DEEP//GLOBAL UNDERSEA UNIT//RIDGE FLANK - Statistics for Countries |
Statistics per Country |
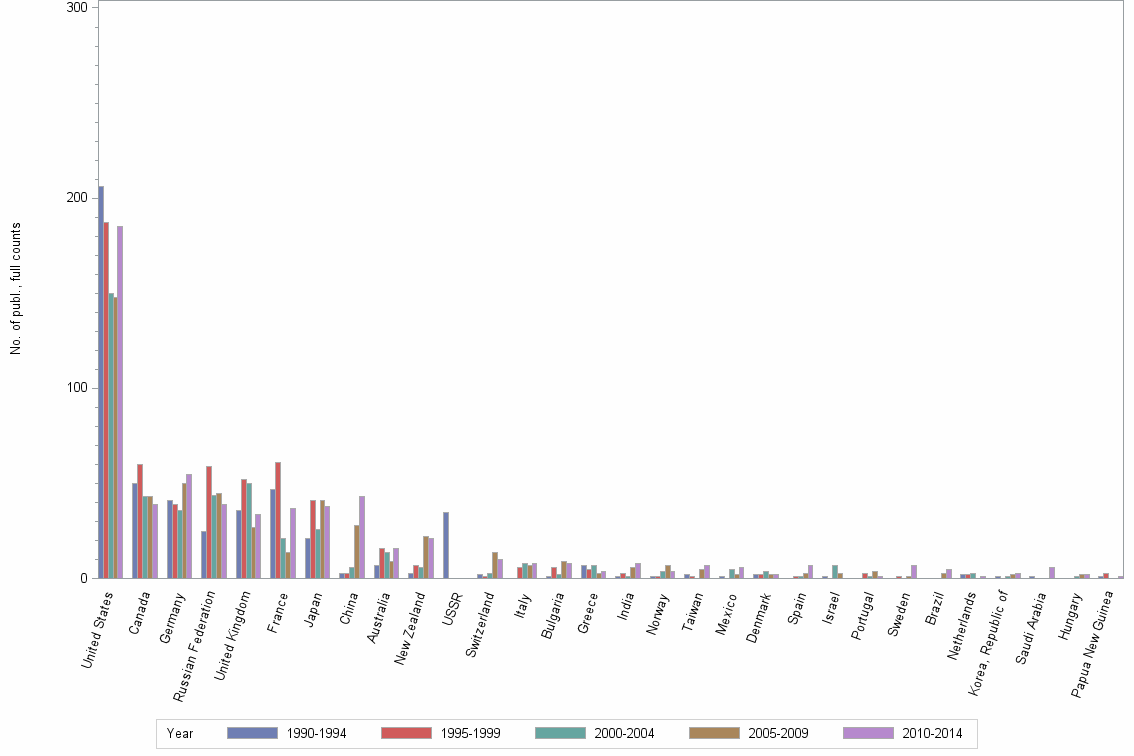
Number of publications, full counts |
| Obs | Country | 1990-1994 | 1995-1999 | 2000-2004 | 2005-2009 | 2010-2014 | All years |
|---|---|---|---|---|---|---|---|
| 1 | All countries | 399 | 404 | 314 | 329 | 375 | 1821 |
| 2 | United States | 206 | 187 | 150 | 148 | 185 | 876 |
| 3 | Canada | 50 | 60 | 43 | 43 | 39 | 235 |
| 4 | Germany | 41 | 39 | 36 | 50 | 55 | 221 |
| 5 | Russian Federation | 25 | 59 | 44 | 45 | 39 | 212 |
| 6 | United Kingdom | 36 | 52 | 50 | 27 | 34 | 199 |
| 7 | France | 47 | 61 | 21 | 14 | 37 | 180 |
| 8 | Japan | 21 | 41 | 26 | 41 | 38 | 167 |
| 9 | China | 3 | 3 | 6 | 28 | 43 | 83 |
| 10 | Australia | 7 | 16 | 14 | 9 | 16 | 62 |
| 11 | New Zealand | 3 | 7 | 6 | 22 | 21 | 59 |
| 12 | USSR | 35 | . | . | . | . | 35 |
| 13 | Switzerland | 2 | 1 | 3 | 14 | 10 | 30 |
| 14 | Italy | . | 6 | 8 | 7 | 8 | 29 |
| 15 | Bulgaria | 1 | 6 | 2 | 9 | 8 | 26 |
| 16 | Greece | 7 | 5 | 7 | 3 | 4 | 26 |
| 17 | India | 1 | 3 | 1 | 6 | 8 | 19 |
| 18 | Norway | 1 | 1 | 4 | 7 | 4 | 17 |
| 19 | Taiwan | 2 | 1 | . | 5 | 7 | 15 |
| 20 | Mexico | 1 | . | 5 | 2 | 6 | 14 |
| 21 | Denmark | 2 | 2 | 4 | 2 | 2 | 12 |
| 22 | Spain | . | 1 | 1 | 3 | 7 | 12 |
| 23 | Israel | 1 | . | 7 | 3 | . | 11 |
| 24 | Portugal | . | 3 | 1 | 4 | 1 | 9 |
| 25 | Sweden | . | 1 | . | 1 | 7 | 9 |
| 26 | Brazil | . | . | . | 3 | 5 | 8 |
| 27 | Netherlands | 2 | 2 | 3 | . | 1 | 8 |
| 28 | Korea, Republic of | 1 | . | 1 | 2 | 3 | 7 |
| 29 | Saudi Arabia | 1 | . | . | . | 6 | 7 |
| 30 | Hungary | . | . | 1 | 2 | 2 | 5 |
| 31 | Papua New Guinea | 1 | 3 | . | . | 1 | 5 |
| 32 | New Caledonia | . | 3 | 1 | . | . | 4 |
| 33 | South Africa | . | 1 | 1 | 1 | 1 | 4 |
| 34 | Tonga | 3 | . | . | 1 | . | 4 |
| 35 | Turkey | . | 1 | 1 | . | 2 | 4 |
| 36 | Egypt | . | . | . | . | 3 | 3 |
| 37 | Ireland | . | 3 | . | . | . | 3 |
| 38 | Monaco | . | . | 1 | 2 | . | 3 |
| 39 | Cyprus | 1 | 1 | . | . | . | 2 |
| 40 | Iceland | . | . | . | 2 | . | 2 |
| 41 | Oman | . | . | . | . | 2 | 2 |
| 42 | Poland | . | 1 | . | . | 1 | 2 |
| 43 | Belgium | 1 | . | . | . | . | 1 |
| 44 | Chile | . | . | 1 | . | . | 1 |
| 45 | Cook Islands | . | 1 | . | . | . | 1 |
| 46 | Cuba | . | . | . | 1 | . | 1 |
| 47 | Czech Republic | . | . | . | 1 | . | 1 |
| 48 | Finland | . | . | . | 1 | . | 1 |
| 49 | Iran, Islamic Republic of | . | . | . | . | 1 | 1 |
| 50 | Morocco | . | . | 1 | . | . | 1 |
| 51 | United Arab Emirates | . | . | . | . | 1 | 1 |
Number of publications, full counts |