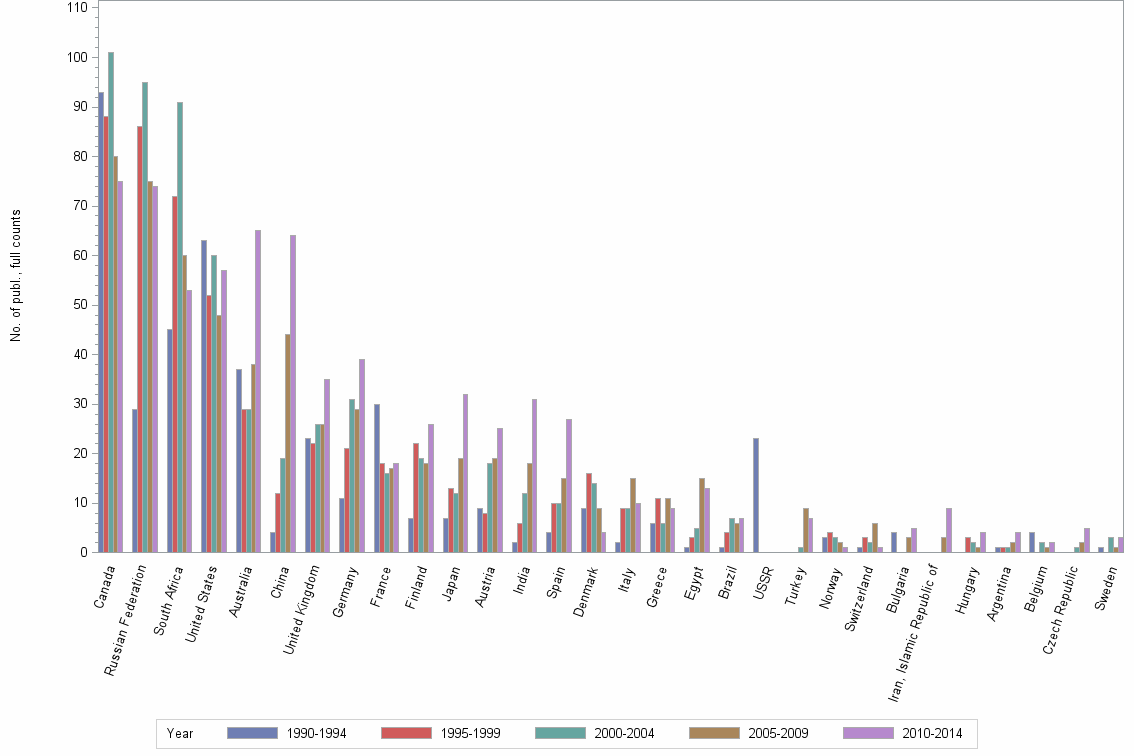
Lev1: PLATINUM GROUP MINERALS//BUSHVELD COMPLEX//CHROMITITE - Statistics for Countries

Statistics per Country

Number of publications, full counts

Obs Country 1990-1994 1995-1999 2000-2004 2005-2009 2010-2014 All years
1 All countries 359 402 416 404 446 2027
2 Canada 93 88 101 80 75 437
3 Russian Federation 29 86 95 75 74 359
4 South Africa 45 72 91 60 53 321
5 United States 63 52 60 48 57 280
6 Australia 37 29 29 38 65 198
7 China 4 12 19 44 64 143
8 United Kingdom 23 22 26 26 35 132
9 Germany 11 21 31 29 39 131
10 France 30 18 16 17 18 99
11 Finland 7 22 19 18 26 92
12 Japan 7 13 12 19 32 83
13 Austria 9 8 18 19 25 79
14 India 2 6 12 18 31 69
15 Spain 4 10 10 15 27 66
16 Denmark 9 16 14 9 4 52
17 Italy 2 9 9 15 10 45
18 Greece 6 11 6 11 9 43
19 Egypt 1 3 5 15 13 37
20 Brazil 1 4 7 6 7 25
21 USSR 23 . . . . 23
22 Turkey . . 1 9 7 17
23 Norway 3 4 3 2 1 13
24 Switzerland 1 3 2 6 1 13
25 Bulgaria 4 . . 3 5 12
26 Iran, Islamic Republic of . . . 3 9 12
27 Hungary . 3 2 1 4 10
28 Argentina 1 1 1 2 4 9
29 Belgium 4 . 2 1 2 9
30 Czech Republic . . 1 2 5 8
31 Sweden 1 . 3 1 3 8
32 Netherlands 3 3 . . 1 7
33 Ukraine . 2 3 1 1 7
34 Philippines . 2 2 . 2 6
35 Saudi Arabia . . 1 . 5 6
36 Chile . 1 1 . 3 5
37 Iraq . . . 3 2 5
38 Morocco . . 1 4 . 5
39 Cuba . . 2 1 1 4
40 Dominican Republic . . . 2 2 4
41 Korea, Republic of . 1 1 2 . 4
42 Mexico . . 2 2 . 4
43 New Caledonia 1 . . 3 . 4
44 Pakistan 3 . . 1 . 4
45 Portugal 1 1 . . 2 4
46 Taiwan . . . 3 1 4
47 Albania 2 . 1 . . 3
48 Cameroon . . . 1 2 3
49 Hong Kong . 3 . . . 3
50 Poland 2 . . 1 . 3
51 Zimbabwe 1 . 2 . . 3

Number of publications, full counts


Bar chart of publication_year

Share of the total number of publications in the field, full counts (%)

Obs Country 1990-1994 1995-1999 2000-2004 2005-2009 2010-2014 All years
1 All countries 100.0 100.0 100.0 100.0 100.0 100.0
2 Canada 25.9 21.9 24.3 19.8 16.8 21.6
3 Russian Federation 8.1 21.4 22.8 18.6 16.6 17.7
4 South Africa 12.5 17.9 21.9 14.9 11.9 15.8
5 United States 17.5 12.9 14.4 11.9 12.8 13.8
6 Australia 10.3 7.2 7.0 9.4 14.6 9.8
7 China 1.1 3.0 4.6 10.9 14.3 7.1
8 United Kingdom 6.4 5.5 6.3 6.4 7.8 6.5
9 Germany 3.1 5.2 7.5 7.2 8.7 6.5
10 France 8.4 4.5 3.8 4.2 4.0 4.9
11 Finland 1.9 5.5 4.6 4.5 5.8 4.5
12 Japan 1.9 3.2 2.9 4.7 7.2 4.1
13 Austria 2.5 2.0 4.3 4.7 5.6 3.9
14 India 0.6 1.5 2.9 4.5 7.0 3.4
15 Spain 1.1 2.5 2.4 3.7 6.1 3.3
16 Denmark 2.5 4.0 3.4 2.2 0.9 2.6
17 Italy 0.6 2.2 2.2 3.7 2.2 2.2
18 Greece 1.7 2.7 1.4 2.7 2.0 2.1
19 Egypt 0.3 0.7 1.2 3.7 2.9 1.8
20 Brazil 0.3 1.0 1.7 1.5 1.6 1.2
21 USSR 6.4 . . . . 1.1
22 Turkey . . 0.2 2.2 1.6 0.8
23 Norway 0.8 1.0 0.7 0.5 0.2 0.6
24 Switzerland 0.3 0.7 0.5 1.5 0.2 0.6
25 Bulgaria 1.1 . . 0.7 1.1 0.6
26 Iran, Islamic Republic of . . . 0.7 2.0 0.6
27 Hungary . 0.7 0.5 0.2 0.9 0.5
28 Argentina 0.3 0.2 0.2 0.5 0.9 0.4
29 Belgium 1.1 . 0.5 0.2 0.4 0.4
30 Czech Republic . . 0.2 0.5 1.1 0.4
31 Sweden 0.3 . 0.7 0.2 0.7 0.4
32 Netherlands 0.8 0.7 . . 0.2 0.3
33 Ukraine . 0.5 0.7 0.2 0.2 0.3
34 Philippines . 0.5 0.5 . 0.4 0.3
35 Saudi Arabia . . 0.2 . 1.1 0.3
36 Chile . 0.2 0.2 . 0.7 0.2
37 Iraq . . . 0.7 0.4 0.2
38 Morocco . . 0.2 1.0 . 0.2
39 Cuba . . 0.5 0.2 0.2 0.2
40 Dominican Republic . . . 0.5 0.4 0.2
41 Korea, Republic of . 0.2 0.2 0.5 . 0.2
42 Mexico . . 0.5 0.5 . 0.2
43 New Caledonia 0.3 . . 0.7 . 0.2
44 Pakistan 0.8 . . 0.2 . 0.2
45 Portugal 0.3 0.2 . . 0.4 0.2
46 Taiwan . . . 0.7 0.2 0.2
47 Albania 0.6 . 0.2 . . 0.1
48 Cameroon . . . 0.2 0.4 0.1
49 Hong Kong . 0.7 . . . 0.1
50 Poland 0.6 . . 0.2 . 0.1
51 Zimbabwe 0.3 . 0.5 . . 0.1

Share of the total number of publications in the field, full counts (%)


Bar chart of publication_year

Number of publications among 10% most cited in field, full counts

Obs Country 1990-1994 1995-1999 2000-2004 2005-2009 2010-2014 All years
1 All countries 41.2 31.0 22.5 27.3 44.7 166.8
2 Canada 18.8 14.4 9.2 8.0 16.7 67.1
3 Russian Federation 4.7 2.8 0.0 0.7 1.0 9.2
4 South Africa 2.0 3.5 2.9 4.0 4.8 17.1
5 United States 9.5 5.9 5.5 7.9 8.5 37.2
6 Australia 4.0 4.0 6.0 4.0 14.8 32.8
7 China 1.0 2.0 1.0 2.9 4.3 11.2
8 United Kingdom 2.1 1.0 0.0 2.0 4.7 9.8
9 Germany 0.0 3.0 4.3 4.6 6.0 18.0
10 France 0.0 2.0 0.5 0.5 1.0 4.0
11 Finland 0.5 0.0 0.0 0.0 3.0 3.5
12 Japan 2.7 0.7 2.2 2.0 2.0 9.6
13 Austria 1.0 1.0 1.0 2.9 1.4 7.3
14 India 0.0 0.0 0.0 0.0 1.0 1.0
15 Spain 0.0 0.0 1.0 1.0 5.0 7.0
16 Denmark 0.0 2.0 0.5 0.0 1.0 3.5
17 Italy 0.0 2.0 0.0 2.4 1.0 5.4
18 Greece 0.0 0.0 0.0 0.4 0.0 0.4
19 Egypt 0.0 0.0 1.9 0.5 1.2 3.6
20 Brazil 0.0 0.0 0.0 0.0 1.3 1.3
21 USSR 3.5 . . . . 3.5
22 Turkey . . 0.0 2.3 0.5 2.8
23 Norway 0.0 0.0 0.0 0.0 0.0 0.0
24 Switzerland 0.0 1.0 0.0 0.5 0.0 1.5
25 Bulgaria 0.0 . . 0.0 1.0 1.0
26 Iran, Islamic Republic of . . . 0.0 0.0 0.0
27 Hungary . 0.0 0.0 0.0 0.0 0.0
28 Argentina 0.0 0.0 0.0 0.8 0.0 0.8
29 Belgium 0.0 . 0.0 0.0 0.0 0.0
30 Czech Republic . . 0.0 0.0 0.0 0.0
31 Sweden 0.5 . 0.0 0.0 0.0 0.5
32 Netherlands 1.0 0.0 . . 0.0 1.0
33 Ukraine . 0.0 0.0 0.0 0.0 0.0
34 Philippines . 0.3 0.0 . 0.0 0.3
35 Saudi Arabia . . 0.0 . 0.0 0.0
36 Chile . 0.0 0.0 . 0.0 0.0
37 Iraq . . . 0.0 0.0 0.0
38 Morocco . . 0.0 0.0 . 0.0
39 Cuba . . 0.0 0.0 1.0 1.0
40 Dominican Republic . . . 0.0 0.0 0.0
41 Korea, Republic of . 0.0 0.0 0.0 . 0.0
42 Mexico . . 1.0 0.3 . 1.3
43 New Caledonia 1.0 . . 0.0 . 1.0
44 Pakistan 0.0 . . 0.0 . 0.0
45 Portugal 0.0 0.0 . . 0.0 0.0
46 Taiwan . . . 0.0 0.0 0.0
47 Albania 0.0 . 0.0 . . 0.0
48 Cameroon . . . 0.0 0.0 0.0
49 Hong Kong . 1.0 . . . 1.0
50 Poland 0.0 . . 0.0 . 0.0
51 Zimbabwe 0.0 . 0.0 . . 0.0

Number of publications among 10% most cited in field, full counts


Bar chart of publication_year

Share of publications among 10% most cited in field, fractionalized (%)

Obs Country 1990-1994 1995-1999 2000-2004 2005-2009 2010-2014 All years
1 All countries 11.5 7.7 5.4 6.8 10.0 8.2
2 Canada 19.0 16.3 8.9 10.1 22.8 15.1
3 Russian Federation 12.4 1.8 0.0 0.4 0.8 1.8
4 South Africa 4.8 5.6 2.0 6.1 9.9 5.2
5 United States 14.8 10.2 11.0 18.3 13.8 13.5
6 Australia 9.4 14.4 25.4 9.0 24.6 16.8
7 China 44.4 8.7 2.4 2.8 5.1 5.1
8 United Kingdom 8.3 1.3 0.0 7.9 16.8 7.2
9 Germany 0.0 12.3 14.9 11.2 16.1 12.6
10 France 0.0 10.4 1.8 1.4 1.9 2.6
11 Finland 3.1 0.0 0.0 0.0 7.9 2.4
12 Japan 35.4 5.1 10.3 14.5 9.4 12.6
13 Austria 16.2 22.2 5.6 8.8 3.6 9.5
14 India 0.0 0.0 0.0 0.0 1.0 0.5
15 Spain 0.0 0.0 5.8 2.8 17.7 8.7
16 Denmark 0.0 9.8 4.4 0.0 31.9 6.2
17 Italy 0.0 27.4 0.0 22.6 5.6 13.8
18 Greece 0.0 0.0 0.0 4.8 0.0 1.0
19 Egypt 0.0 0.0 32.4 1.1 8.6 8.2
20 Brazil 0.0 0.0 0.0 0.0 12.2 3.0
21 USSR 12.7 . . . . 12.7
22 Turkey . . 0.0 22.9 5.3 13.5
23 Norway 0.0 0.0 0.0 0.0 0.0 0.0
24 Switzerland 0.0 22.2 0.0 4.1 0.0 5.0
25 Bulgaria 0.0 . . 0.0 8.5 2.6
26 Iran, Islamic Republic of . . . 0.0 0.0 0.0
27 Hungary . 0.0 0.0 0.0 0.0 0.0
28 Argentina 0.0 0.0 0.0 28.5 0.0 6.2
29 Belgium 0.0 . 0.0 0.0 0.0 0.0
30 Czech Republic . . 0.0 0.0 0.0 0.0
31 Sweden 50.0 . 0.0 0.0 0.0 2.1
32 Netherlands 40.0 0.0 . . 0.0 20.0
33 Ukraine . 0.0 0.0 0.0 0.0 0.0
34 Philippines . 11.4 0.0 . 0.0 3.0
35 Saudi Arabia . . 0.0 . 0.0 0.0
36 Chile . 0.0 0.0 . 0.0 0.0
37 Iraq . . . 0.0 0.0 0.0
38 Morocco . . 0.0 0.0 . 0.0
39 Cuba . . 0.0 0.0 100.0 28.6
40 Dominican Republic . . . 0.0 0.0 0.0
41 Korea, Republic of . 0.0 0.0 0.0 . 0.0
42 Mexico . . 57.1 18.0 . 47.3
43 New Caledonia 100.0 . . 0.0 . 41.7
44 Pakistan 0.0 . . 0.0 . 0.0
45 Portugal 0.0 0.0 . . 0.0 0.0
46 Taiwan . . . 0.0 0.0 0.0
47 Albania 0.0 . 0.0 . . 0.0
48 Cameroon . . . 0.0 0.0 0.0
49 Hong Kong . 25.0 . . . 25.0
50 Poland 0.0 . . 0.0 . 0.0
51 Zimbabwe 0.0 . 0.0 . . 0.0

Share of publications among 10% most cited in field, fractionalized (%)


Bar chart of publication_year

Field normalized citation rate (cf), fractionalized

Obs Country 1990-1994 1995-1999 2000-2004 2005-2009 2010-2014 All years
1 All countries 1.06 0.82 0.76 0.82 0.96 0.88
2 Canada 1.41 1.40 1.12 1.07 1.87 1.34
3 Russian Federation 0.42 0.27 0.25 0.21 0.27 0.27
4 South Africa 1.02 0.64 0.62 0.77 0.85 0.75
5 United States 1.48 1.00 1.14 1.19 1.10 1.20
6 Australia 1.12 1.32 2.18 1.01 1.76 1.46
7 China 1.60 0.80 0.43 0.82 0.89 0.81
8 United Kingdom 0.78 0.64 0.47 1.49 1.26 0.93
9 Germany 0.68 1.24 1.10 1.15 1.38 1.18
10 France 0.85 1.10 0.86 0.83 0.63 0.86
11 Finland 0.43 0.54 0.48 0.37 1.04 0.62
12 Japan 3.00 0.98 1.05 1.13 0.83 1.18
13 Austria 1.33 1.43 0.86 0.78 0.47 0.89
14 India 0.38 0.30 0.46 0.32 0.50 0.43
15 Spain 0.76 1.06 0.98 1.03 1.17 1.06
16 Denmark 0.54 0.93 0.87 0.65 1.61 0.83
17 Italy 0.77 1.45 0.82 1.43 0.76 1.11
18 Greece 0.61 0.28 0.35 0.72 0.41 0.46
19 Egypt 0.75 0.33 1.86 0.75 0.72 0.87
20 Brazil 0.49 0.48 0.42 0.26 0.73 0.47
21 USSR 0.39 . . . . 0.39
22 Turkey . . 0.08 1.08 1.34 1.08
23 Norway 1.15 0.37 0.28 0.60 0.59 0.70
24 Switzerland 0.11 2.48 0.45 1.19 0.42 1.04
25 Bulgaria 0.38 . . 1.27 0.79 0.64
26 Iran, Islamic Republic of . . . 0.30 0.64 0.58
27 Hungary . 0.81 0.98 0.55 0.41 0.68
28 Argentina 0.75 1.22 0.37 1.47 0.13 0.56
29 Belgium 0.27 . 0.50 0.05 0.26 0.30
30 Czech Republic . . 0.31 0.30 0.22 0.26
31 Sweden 2.57 . 0.20 1.21 0.42 0.51
32 Netherlands 1.07 0.31 . . 0.00 0.66
33 Ukraine . 0.40 0.15 0.00 0.39 0.21
34 Philippines . 0.81 0.27 . 0.35 0.43
35 Saudi Arabia . . 0.00 . 0.92 0.59
36 Chile . 0.11 0.17 . 0.36 0.22
37 Iraq . . . 0.43 0.42 0.42
38 Morocco . . 0.00 1.06 . 0.65
39 Cuba . . 0.13 1.23 5.37 1.87
40 Dominican Republic . . . 1.13 0.30 0.70
41 Korea, Republic of . 0.23 1.18 0.29 . 0.47
42 Mexico . . 1.55 1.33 . 1.49
43 New Caledonia 2.45 . . 0.67 . 1.41
44 Pakistan 0.41 . . 1.00 . 0.61
45 Portugal 0.48 0.67 . . 0.41 0.47
46 Taiwan . . . 0.82 0.44 0.72
47 Albania 0.61 . 0.10 . . 0.51
48 Cameroon . . . 0.15 0.07 0.09
49 Hong Kong . 2.70 . . . 2.70
50 Poland 0.28 . . 0.49 . 0.40
51 Zimbabwe 0.49 . 0.65 . . 0.59

Field normalized citation rate (cf), fractionalized


Bar chart of publication_year