Lev1: MANGANESE OXIDE ORE//ELECTROGENERATIVE LEACHING//REDUCTIVE LEACHING - Statistics for Countries |
Statistics per Country |
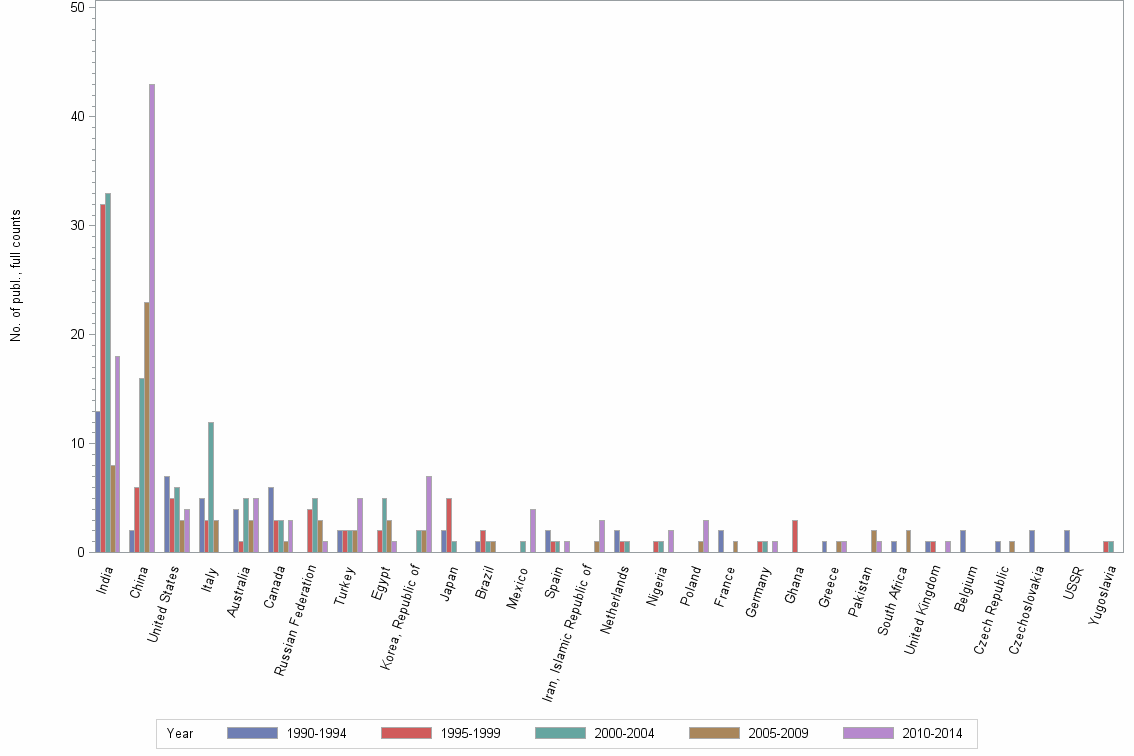
Number of publications, full counts |
| Obs | Country | 1990-1994 | 1995-1999 | 2000-2004 | 2005-2009 | 2010-2014 | All years |
|---|---|---|---|---|---|---|---|
| 1 | All countries | 58 | 73 | 89 | 62 | 96 | 378 |
| 2 | India | 13 | 32 | 33 | 8 | 18 | 104 |
| 3 | China | 2 | 6 | 16 | 23 | 43 | 90 |
| 4 | United States | 7 | 5 | 6 | 3 | 4 | 25 |
| 5 | Italy | 5 | 3 | 12 | 3 | . | 23 |
| 6 | Australia | 4 | 1 | 5 | 3 | 5 | 18 |
| 7 | Canada | 6 | 3 | 3 | 1 | 3 | 16 |
| 8 | Russian Federation | . | 4 | 5 | 3 | 1 | 13 |
| 9 | Turkey | 2 | 2 | 2 | 2 | 5 | 13 |
| 10 | Egypt | . | 2 | 5 | 3 | 1 | 11 |
| 11 | Korea, Republic of | . | . | 2 | 2 | 7 | 11 |
| 12 | Japan | 2 | 5 | 1 | . | . | 8 |
| 13 | Brazil | 1 | 2 | 1 | 1 | . | 5 |
| 14 | Mexico | . | . | 1 | . | 4 | 5 |
| 15 | Spain | 2 | 1 | 1 | . | 1 | 5 |
| 16 | Iran, Islamic Republic of | . | . | . | 1 | 3 | 4 |
| 17 | Netherlands | 2 | 1 | 1 | . | . | 4 |
| 18 | Nigeria | . | 1 | 1 | . | 2 | 4 |
| 19 | Poland | . | . | . | 1 | 3 | 4 |
| 20 | France | 2 | . | . | 1 | . | 3 |
| 21 | Germany | . | 1 | 1 | . | 1 | 3 |
| 22 | Ghana | . | 3 | . | . | . | 3 |
| 23 | Greece | 1 | . | . | 1 | 1 | 3 |
| 24 | Pakistan | . | . | . | 2 | 1 | 3 |
| 25 | South Africa | 1 | . | . | 2 | . | 3 |
| 26 | United Kingdom | 1 | 1 | . | . | 1 | 3 |
| 27 | Belgium | 2 | . | . | . | . | 2 |
| 28 | Czech Republic | 1 | . | . | 1 | . | 2 |
| 29 | Czechoslovakia | 2 | . | . | . | . | 2 |
| 30 | USSR | 2 | . | . | . | . | 2 |
| 31 | Yugoslavia | . | 1 | 1 | . | . | 2 |
| 32 | Argentina | 1 | . | . | . | . | 1 |
| 33 | Chile | . | . | 1 | . | . | 1 |
| 34 | Cuba | 1 | . | . | . | . | 1 |
| 35 | Israel | . | . | . | 1 | . | 1 |
| 36 | Malaysia | . | . | . | 1 | . | 1 |
| 37 | Morocco | . | . | . | 1 | . | 1 |
| 38 | Slovak Republic | . | . | . | . | 1 | 1 |
| 39 | Taiwan | . | . | . | 1 | . | 1 |
Number of publications, full counts |