Lev1: DISSOLVED AIR FLOTATION//DISSOLVED AIR FLOTATION DAF//TECNOL MINERAL AMBIENTAL - Statistics for Countries |
Statistics per Country |
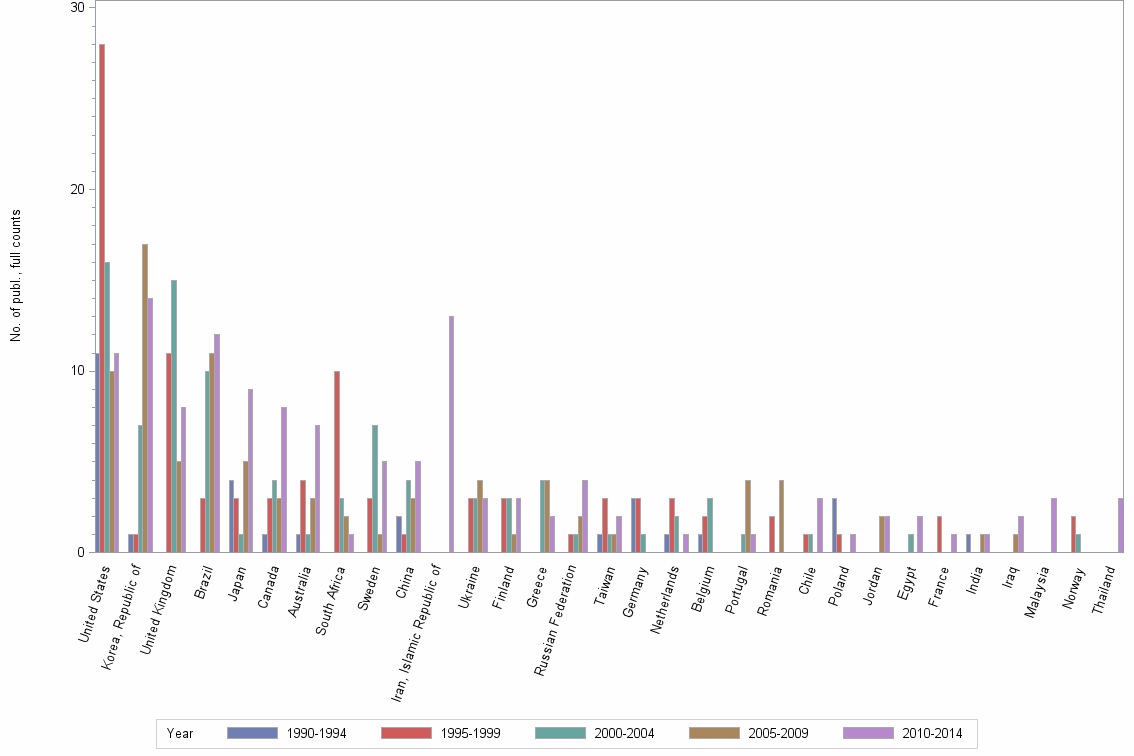
Number of publications, full counts |
| Obs | Country | 1990-1994 | 1995-1999 | 2000-2004 | 2005-2009 | 2010-2014 | All years |
|---|---|---|---|---|---|---|---|
| 1 | All countries | 33 | 90 | 83 | 85 | 101 | 392 |
| 2 | United States | 11 | 28 | 16 | 10 | 11 | 76 |
| 3 | Korea, Republic of | 1 | 1 | 7 | 17 | 14 | 40 |
| 4 | United Kingdom | . | 11 | 15 | 5 | 8 | 39 |
| 5 | Brazil | . | 3 | 10 | 11 | 12 | 36 |
| 6 | Japan | 4 | 3 | 1 | 5 | 9 | 22 |
| 7 | Canada | 1 | 3 | 4 | 3 | 8 | 19 |
| 8 | Australia | 1 | 4 | 1 | 3 | 7 | 16 |
| 9 | South Africa | . | 10 | 3 | 2 | 1 | 16 |
| 10 | Sweden | . | 3 | 7 | 1 | 5 | 16 |
| 11 | China | 2 | 1 | 4 | 3 | 5 | 15 |
| 12 | Iran, Islamic Republic of | . | . | . | . | 13 | 13 |
| 13 | Ukraine | . | 3 | 3 | 4 | 3 | 13 |
| 14 | Finland | . | 3 | 3 | 1 | 3 | 10 |
| 15 | Greece | . | . | 4 | 4 | 2 | 10 |
| 16 | Russian Federation | . | 1 | 1 | 2 | 4 | 8 |
| 17 | Taiwan | 1 | 3 | 1 | 1 | 2 | 8 |
| 18 | Germany | 3 | 3 | 1 | . | . | 7 |
| 19 | Netherlands | 1 | 3 | 2 | . | 1 | 7 |
| 20 | Belgium | 1 | 2 | 3 | . | . | 6 |
| 21 | Portugal | . | . | 1 | 4 | 1 | 6 |
| 22 | Romania | . | 2 | . | 4 | . | 6 |
| 23 | Chile | . | 1 | 1 | . | 3 | 5 |
| 24 | Poland | 3 | 1 | . | . | 1 | 5 |
| 25 | Jordan | . | . | . | 2 | 2 | 4 |
| 26 | Egypt | . | . | 1 | . | 2 | 3 |
| 27 | France | . | 2 | . | . | 1 | 3 |
| 28 | India | 1 | . | . | 1 | 1 | 3 |
| 29 | Iraq | . | . | . | 1 | 2 | 3 |
| 30 | Malaysia | . | . | . | . | 3 | 3 |
| 31 | Norway | . | 2 | 1 | . | . | 3 |
| 32 | Thailand | . | . | . | . | 3 | 3 |
| 33 | Austria | . | 2 | . | . | . | 2 |
| 34 | Israel | . | 1 | 1 | . | . | 2 |
| 35 | Kazakhstan | . | . | . | . | 2 | 2 |
| 36 | Spain | . | 2 | . | . | . | 2 |
| 37 | Algeria | . | . | . | 1 | . | 1 |
| 38 | Hungary | . | . | 1 | . | . | 1 |
| 39 | Ireland | . | . | . | 1 | . | 1 |
| 40 | Kuwait | . | . | . | 1 | . | 1 |
| 41 | Mexico | . | . | . | . | 1 | 1 |
| 42 | New Zealand | . | . | . | 1 | . | 1 |
| 43 | Pakistan | 1 | . | . | . | . | 1 |
| 44 | Panama | . | . | 1 | . | . | 1 |
| 45 | Republic of Serbia | . | . | . | . | 1 | 1 |
| 46 | Saudi Arabia | . | . | . | . | 1 | 1 |
| 47 | Slovenia | . | 1 | . | . | . | 1 |
| 48 | Trinidad and Tobago | . | . | 1 | . | . | 1 |
| 49 | Tunisia | . | . | . | . | 1 | 1 |
| 50 | Turkey | . | . | . | . | 1 | 1 |
| 51 | Venezuela | . | . | . | 1 | . | 1 |
Number of publications, full counts |