Lev1: BELOMORIAN PROVINCE//BELOMORIAN MOBILE BELT//GRIDINO - Statistics for Countries |
Statistics per Country |
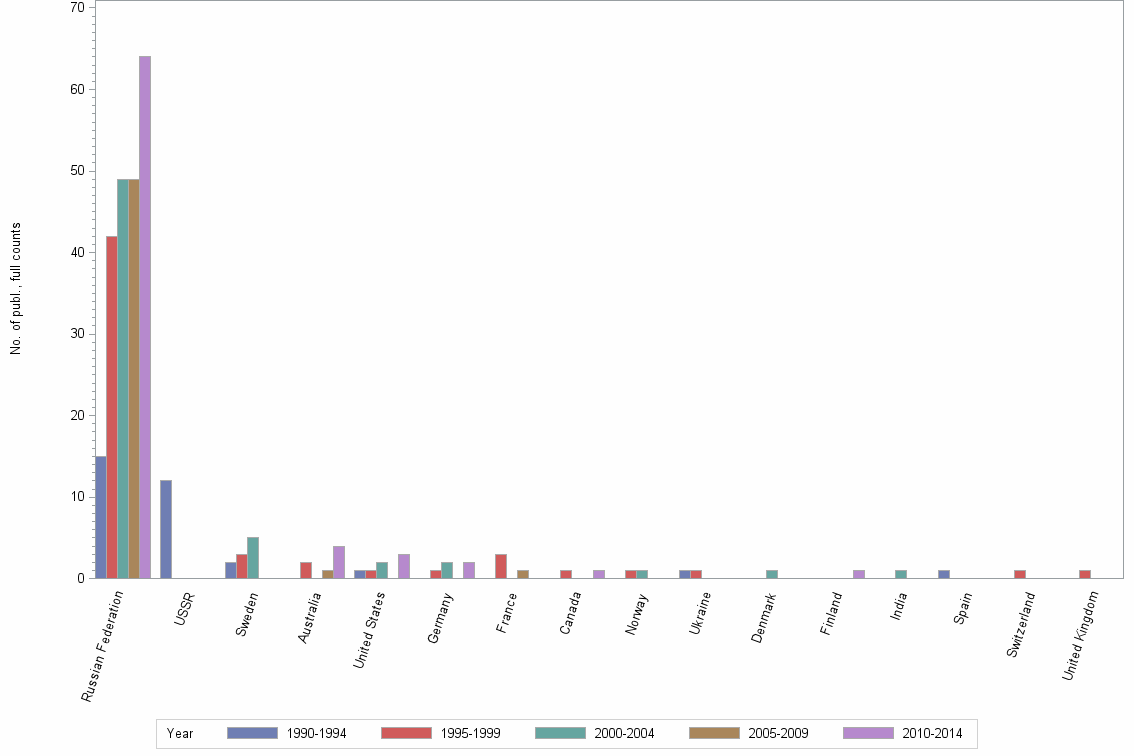
Number of publications, full counts |
| Obs | Country | 1990-1994 | 1995-1999 | 2000-2004 | 2005-2009 | 2010-2014 | All years |
|---|---|---|---|---|---|---|---|
| 1 | All countries | 30 | 44 | 51 | 49 | 65 | 239 |
| 2 | Russian Federation | 15 | 42 | 49 | 49 | 64 | 219 |
| 3 | USSR | 12 | . | . | . | . | 12 |
| 4 | Sweden | 2 | 3 | 5 | . | . | 10 |
| 5 | Australia | . | 2 | . | 1 | 4 | 7 |
| 6 | United States | 1 | 1 | 2 | . | 3 | 7 |
| 7 | Germany | . | 1 | 2 | . | 2 | 5 |
| 8 | France | . | 3 | . | 1 | . | 4 |
| 9 | Canada | . | 1 | . | . | 1 | 2 |
| 10 | Norway | . | 1 | 1 | . | . | 2 |
| 11 | Ukraine | 1 | 1 | . | . | . | 2 |
| 12 | Denmark | . | . | 1 | . | . | 1 |
| 13 | Finland | . | . | . | . | 1 | 1 |
| 14 | India | . | . | 1 | . | . | 1 |
| 15 | Spain | 1 | . | . | . | . | 1 |
| 16 | Switzerland | . | 1 | . | . | . | 1 |
| 17 | United Kingdom | . | 1 | . | . | . | 1 |
Number of publications, full counts |