Lev1: KAMPHAUGITE Y//RARE EARTH CARBONATE HYDROXIDES//MONT SAINT HILAIRE - Statistics for Countries |
Statistics per Country |
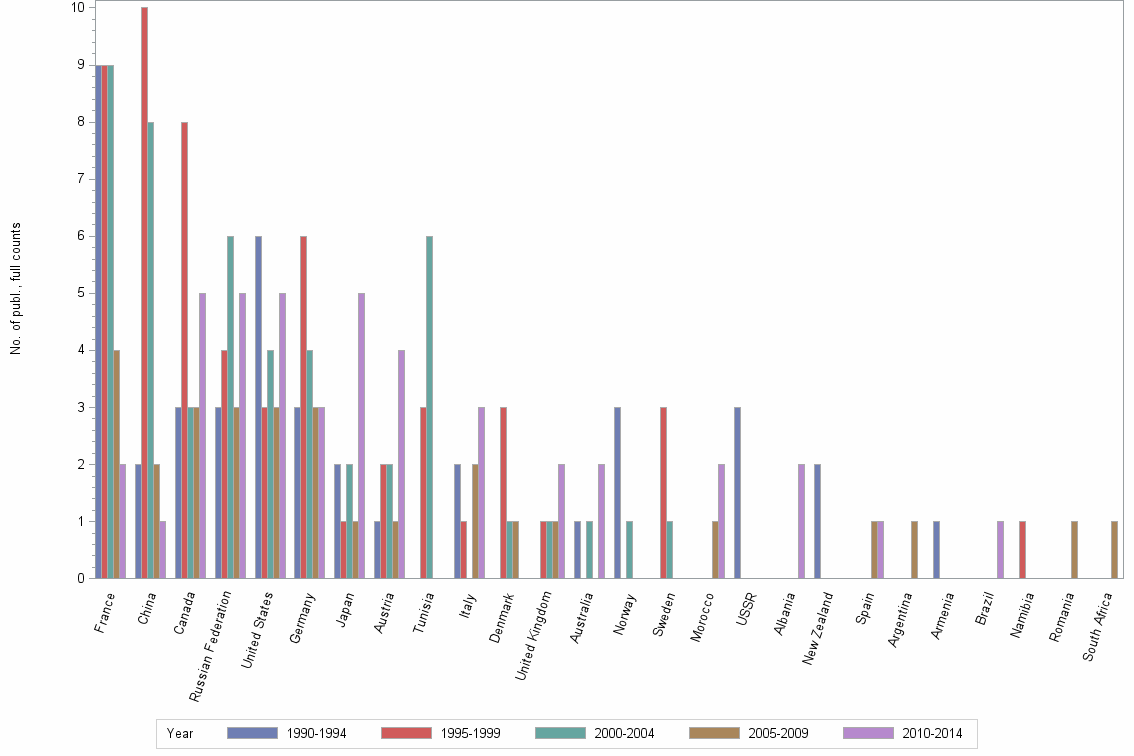
Number of publications, full counts |
| Obs | Country | 1990-1994 | 1995-1999 | 2000-2004 | 2005-2009 | 2010-2014 | All years |
|---|---|---|---|---|---|---|---|
| 1 | All countries | 36 | 43 | 33 | 22 | 29 | 163 |
| 2 | France | 9 | 9 | 9 | 4 | 2 | 33 |
| 3 | China | 2 | 10 | 8 | 2 | 1 | 23 |
| 4 | Canada | 3 | 8 | 3 | 3 | 5 | 22 |
| 5 | Russian Federation | 3 | 4 | 6 | 3 | 5 | 21 |
| 6 | United States | 6 | 3 | 4 | 3 | 5 | 21 |
| 7 | Germany | 3 | 6 | 4 | 3 | 3 | 19 |
| 8 | Japan | 2 | 1 | 2 | 1 | 5 | 11 |
| 9 | Austria | 1 | 2 | 2 | 1 | 4 | 10 |
| 10 | Tunisia | . | 3 | 6 | . | . | 9 |
| 11 | Italy | 2 | 1 | . | 2 | 3 | 8 |
| 12 | Denmark | . | 3 | 1 | 1 | . | 5 |
| 13 | United Kingdom | . | 1 | 1 | 1 | 2 | 5 |
| 14 | Australia | 1 | . | 1 | . | 2 | 4 |
| 15 | Norway | 3 | . | 1 | . | . | 4 |
| 16 | Sweden | . | 3 | 1 | . | . | 4 |
| 17 | Morocco | . | . | . | 1 | 2 | 3 |
| 18 | USSR | 3 | . | . | . | . | 3 |
| 19 | Albania | . | . | . | . | 2 | 2 |
| 20 | New Zealand | 2 | . | . | . | . | 2 |
| 21 | Spain | . | . | . | 1 | 1 | 2 |
| 22 | Argentina | . | . | . | 1 | . | 1 |
| 23 | Armenia | 1 | . | . | . | . | 1 |
| 24 | Brazil | . | . | . | . | 1 | 1 |
| 25 | Namibia | . | 1 | . | . | . | 1 |
| 26 | Romania | . | . | . | 1 | . | 1 |
| 27 | South Africa | . | . | . | 1 | . | 1 |
Number of publications, full counts |