Lev1: CIVIL ENGN GEOL SCI//URANYL SULFATE//URANYL ARSENATE - Statistics for Countries |
Statistics per Country |
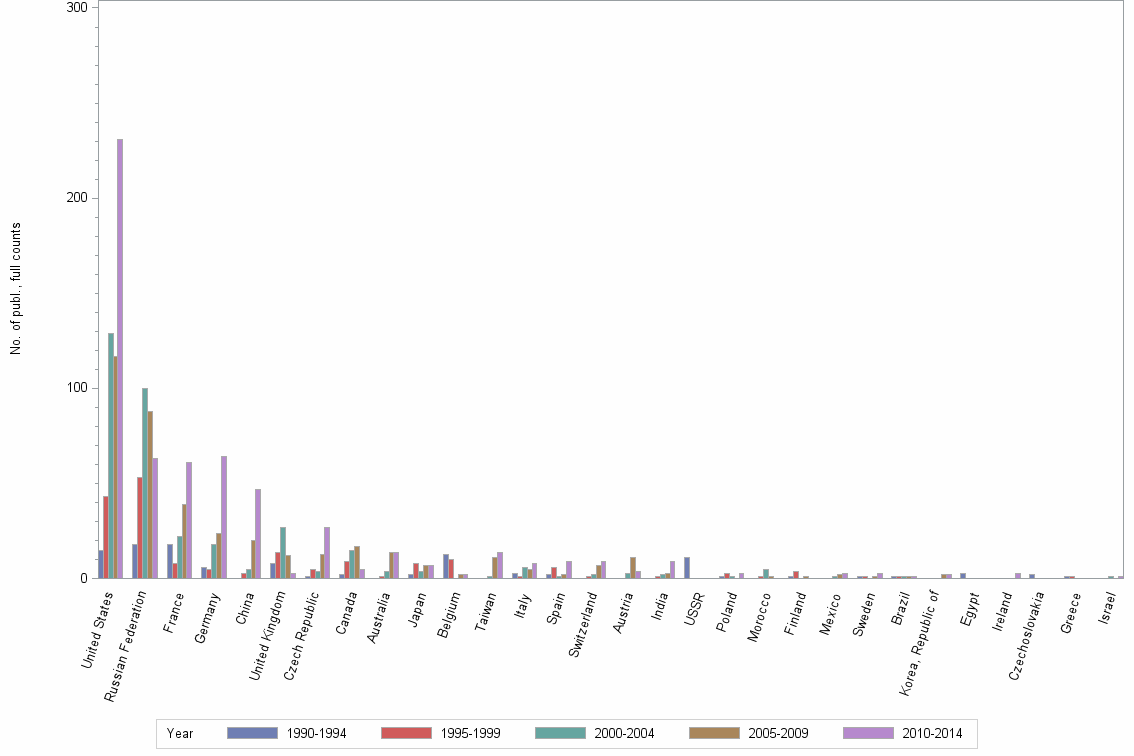
Number of publications, full counts |
| Obs | Country | 1990-1994 | 1995-1999 | 2000-2004 | 2005-2009 | 2010-2014 | All years |
|---|---|---|---|---|---|---|---|
| 1 | All countries | 131 | 151 | 283 | 314 | 458 | 1337 |
| 2 | United States | 15 | 43 | 129 | 117 | 231 | 535 |
| 3 | Russian Federation | 18 | 53 | 100 | 88 | 63 | 322 |
| 4 | France | 18 | 8 | 22 | 39 | 61 | 148 |
| 5 | Germany | 6 | 5 | 18 | 24 | 64 | 117 |
| 6 | China | . | 3 | 5 | 20 | 47 | 75 |
| 7 | United Kingdom | 8 | 14 | 27 | 12 | 3 | 64 |
| 8 | Czech Republic | 1 | 5 | 4 | 13 | 27 | 50 |
| 9 | Canada | 2 | 9 | 15 | 17 | 5 | 48 |
| 10 | Australia | . | 1 | 4 | 14 | 14 | 33 |
| 11 | Japan | 2 | 8 | 4 | 7 | 7 | 28 |
| 12 | Belgium | 13 | 10 | . | 2 | 2 | 27 |
| 13 | Taiwan | . | . | 1 | 11 | 14 | 26 |
| 14 | Italy | 3 | 1 | 6 | 5 | 8 | 23 |
| 15 | Spain | 2 | 6 | 1 | 2 | 9 | 20 |
| 16 | Switzerland | . | 1 | 2 | 7 | 9 | 19 |
| 17 | Austria | . | . | 3 | 11 | 4 | 18 |
| 18 | India | . | 1 | 2 | 3 | 9 | 15 |
| 19 | USSR | 11 | . | . | . | . | 11 |
| 20 | Poland | 1 | 3 | 1 | . | 3 | 8 |
| 21 | Morocco | . | 1 | 5 | 1 | . | 7 |
| 22 | Finland | 1 | 4 | . | 1 | . | 6 |
| 23 | Mexico | . | . | 1 | 2 | 3 | 6 |
| 24 | Sweden | 1 | 1 | . | 1 | 3 | 6 |
| 25 | Brazil | 1 | 1 | 1 | 1 | 1 | 5 |
| 26 | Korea, Republic of | . | . | . | 2 | 2 | 4 |
| 27 | Egypt | 3 | . | . | . | . | 3 |
| 28 | Ireland | . | . | . | . | 3 | 3 |
| 29 | Czechoslovakia | 2 | . | . | . | . | 2 |
| 30 | Greece | 1 | 1 | . | . | . | 2 |
| 31 | Israel | . | . | 1 | . | 1 | 2 |
| 32 | Argentina | 1 | . | . | . | . | 1 |
| 33 | Azerbaijan | . | . | . | . | 1 | 1 |
| 34 | Belarus | . | . | . | 1 | . | 1 |
| 35 | Ecuador | . | . | . | . | 1 | 1 |
| 36 | Iran, Islamic Republic of | . | . | . | 1 | . | 1 |
| 37 | Malaysia | . | . | . | 1 | . | 1 |
| 38 | Netherlands | 1 | . | . | . | . | 1 |
| 39 | Romania | 1 | . | . | . | . | 1 |
Number of publications, full counts |