Lev1: GRANITIC PEGMATITES//PEGMATITE//COLUMBITE GROUP MINERALS - Statistics for Countries |
Statistics per Country |
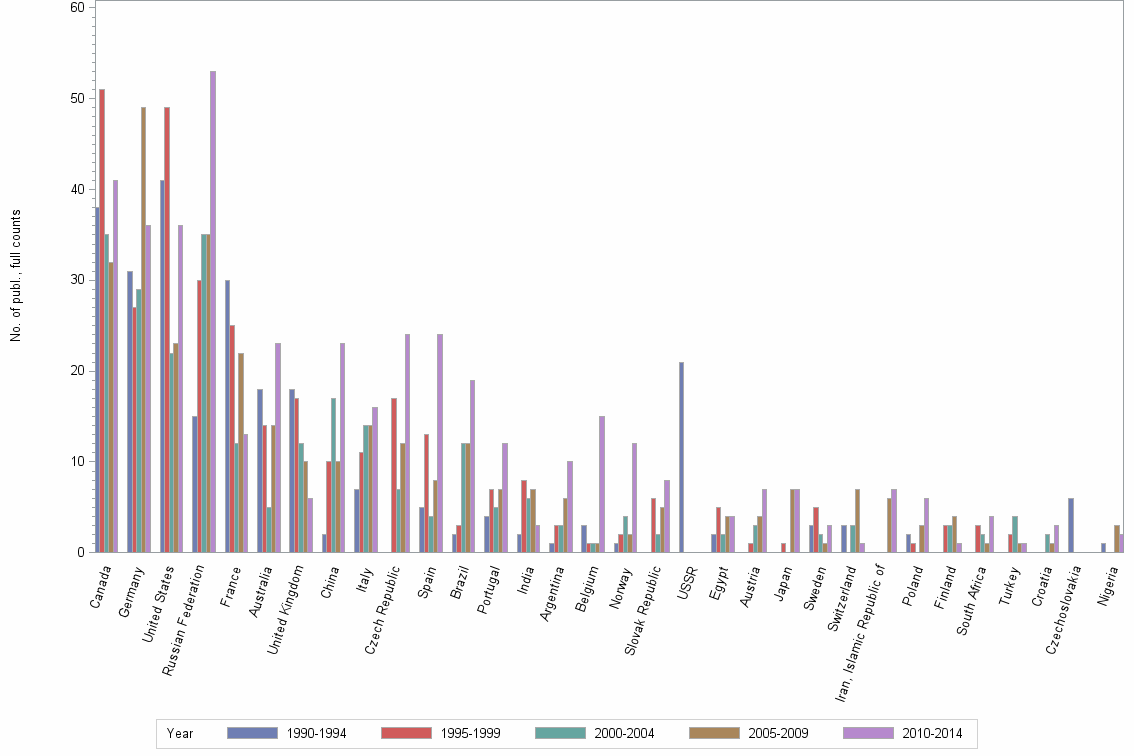
Number of publications, full counts |
| Obs | Country | 1990-1994 | 1995-1999 | 2000-2004 | 2005-2009 | 2010-2014 | All years |
|---|---|---|---|---|---|---|---|
| 1 | All countries | 227 | 253 | 194 | 204 | 273 | 1151 |
| 2 | Canada | 38 | 51 | 35 | 32 | 41 | 197 |
| 3 | Germany | 31 | 27 | 29 | 49 | 36 | 172 |
| 4 | United States | 41 | 49 | 22 | 23 | 36 | 171 |
| 5 | Russian Federation | 15 | 30 | 35 | 35 | 53 | 168 |
| 6 | France | 30 | 25 | 12 | 22 | 13 | 102 |
| 7 | Australia | 18 | 14 | 5 | 14 | 23 | 74 |
| 8 | United Kingdom | 18 | 17 | 12 | 10 | 6 | 63 |
| 9 | China | 2 | 10 | 17 | 10 | 23 | 62 |
| 10 | Italy | 7 | 11 | 14 | 14 | 16 | 62 |
| 11 | Czech Republic | . | 17 | 7 | 12 | 24 | 60 |
| 12 | Spain | 5 | 13 | 4 | 8 | 24 | 54 |
| 13 | Brazil | 2 | 3 | 12 | 12 | 19 | 48 |
| 14 | Portugal | 4 | 7 | 5 | 7 | 12 | 35 |
| 15 | India | 2 | 8 | 6 | 7 | 3 | 26 |
| 16 | Argentina | 1 | 3 | 3 | 6 | 10 | 23 |
| 17 | Belgium | 3 | 1 | 1 | 1 | 15 | 21 |
| 18 | Norway | 1 | 2 | 4 | 2 | 12 | 21 |
| 19 | Slovak Republic | . | 6 | 2 | 5 | 8 | 21 |
| 20 | USSR | 21 | . | . | . | . | 21 |
| 21 | Egypt | 2 | 5 | 2 | 4 | 4 | 17 |
| 22 | Austria | . | 1 | 3 | 4 | 7 | 15 |
| 23 | Japan | . | 1 | . | 7 | 7 | 15 |
| 24 | Sweden | 3 | 5 | 2 | 1 | 3 | 14 |
| 25 | Switzerland | 3 | . | 3 | 7 | 1 | 14 |
| 26 | Iran, Islamic Republic of | . | . | . | 6 | 7 | 13 |
| 27 | Poland | 2 | 1 | . | 3 | 6 | 12 |
| 28 | Finland | . | 3 | 3 | 4 | 1 | 11 |
| 29 | South Africa | . | 3 | 2 | 1 | 4 | 10 |
| 30 | Turkey | . | 2 | 4 | 1 | 1 | 8 |
| 31 | Croatia | . | . | 2 | 1 | 3 | 6 |
| 32 | Czechoslovakia | 6 | . | . | . | . | 6 |
| 33 | Nigeria | 1 | . | . | 3 | 2 | 6 |
| 34 | Indonesia | 4 | 1 | . | . | . | 5 |
| 35 | Morocco | 1 | . | 1 | 2 | . | 4 |
| 36 | Thailand | . | 3 | 1 | . | . | 4 |
| 37 | Denmark | 1 | 1 | 1 | . | . | 3 |
| 38 | Hungary | . | . | 1 | . | 2 | 3 |
| 39 | Netherlands | 2 | 1 | . | . | . | 3 |
| 40 | Algeria | . | . | 1 | . | 1 | 2 |
| 41 | Ethiopia | . | 1 | . | 1 | . | 2 |
| 42 | Greece | . | 2 | . | . | . | 2 |
| 43 | Ireland | 2 | . | . | . | . | 2 |
| 44 | Luxembourg | . | . | . | . | 2 | 2 |
| 45 | Malaysia | 1 | 1 | . | . | . | 2 |
| 46 | Mexico | . | 1 | . | . | 1 | 2 |
| 47 | Mozambique | 2 | . | . | . | . | 2 |
| 48 | Romania | . | . | . | . | 2 | 2 |
| 49 | Israel | . | 1 | . | . | . | 1 |
| 50 | Kyrgyz Republic | . | . | . | . | 1 | 1 |
| 51 | Lebanon | . | . | . | 1 | . | 1 |
| 52 | Macedonia | . | . | . | . | 1 | 1 |
| 53 | Mongolia | . | . | . | . | 1 | 1 |
| 54 | New Zealand | . | . | . | . | 1 | 1 |
| 55 | Pakistan | . | 1 | . | . | . | 1 |
| 56 | Slovenia | . | . | . | . | 1 | 1 |
| 57 | Sri Lanka | . | . | . | 1 | . | 1 |
| 58 | Swaziland | . | 1 | . | . | . | 1 |
| 59 | Tajikistan | . | 1 | . | . | . | 1 |
| 60 | Tunisia | . | . | . | . | 1 | 1 |
| 61 | Ukraine | . | . | . | . | 1 | 1 |
| 62 | Viet Nam | . | 1 | . | . | . | 1 |
| 63 | Zimbabwe | 1 | . | . | . | . | 1 |
Number of publications, full counts |