| All organizations |
125 |
152 |
185 |
201 |
332 |
995 |
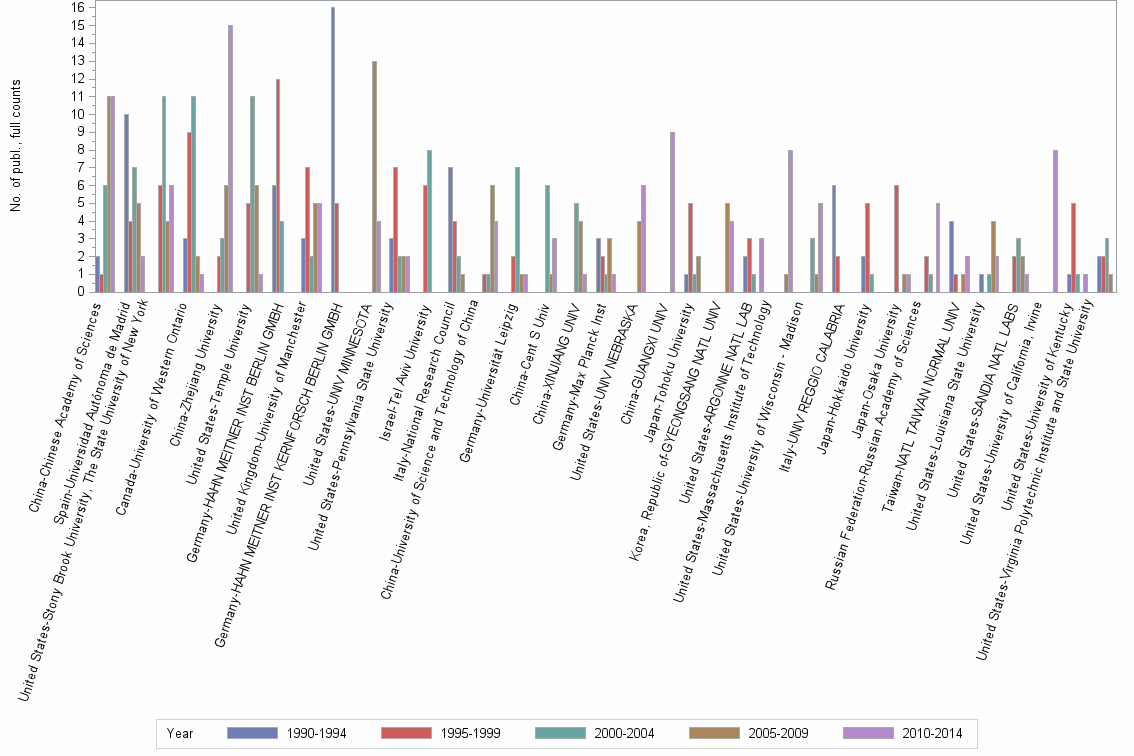
| China-Chinese Academy of Sciences |
2 |
1 |
6 |
11 |
11 |
31 |
| Spain-Universidad Autónoma de Madrid |
10 |
4 |
7 |
5 |
2 |
28 |
| United States-Stony Brook University, The State University of New York |
. |
6 |
11 |
4 |
6 |
27 |
| Canada-University of Western Ontario |
3 |
9 |
11 |
2 |
1 |
26 |
| China-Zhejiang University |
. |
2 |
3 |
6 |
15 |
26 |
| United States-Temple University |
. |
5 |
11 |
6 |
1 |
23 |
| Germany-HAHN MEITNER INST BERLIN GMBH |
6 |
12 |
4 |
. |
. |
22 |
| United Kingdom-University of Manchester |
3 |
7 |
2 |
5 |
5 |
22 |
| Germany-HAHN MEITNER INST KERNFORSCH BERLIN GMBH |
16 |
5 |
. |
. |
. |
21 |
| United States-UNIV MINNESOTA |
. |
. |
. |
13 |
4 |
17 |
| United States-Pennsylvania State University |
3 |
7 |
2 |
2 |
2 |
16 |
| Israel-Tel Aviv University |
. |
6 |
8 |
. |
. |
14 |
| Italy-National Research Council |
7 |
4 |
2 |
1 |
. |
14 |
| China-University of Science and Technology of China |
. |
1 |
1 |
6 |
4 |
12 |
| Germany-Universität Leipzig |
. |
2 |
7 |
1 |
1 |
11 |
| China-Cent S Univ |
. |
. |
6 |
1 |
3 |
10 |
| China-XINJIANG UNIV |
. |
. |
5 |
4 |
1 |
10 |
| Germany-Max Planck Inst |
3 |
2 |
1 |
3 |
1 |
10 |
| United States-UNIV NEBRASKA |
. |
. |
. |
4 |
6 |
10 |
| China-GUANGXI UNIV |
. |
. |
. |
. |
9 |
9 |
| Japan-Tohoku University |
1 |
5 |
1 |
2 |
. |
9 |
| Korea, Republic of-GYEONGSANG NATL UNIV |
. |
. |
. |
5 |
4 |
9 |
| United States-ARGONNE NATL LAB |
2 |
3 |
1 |
. |
3 |
9 |
| United States-Massachusetts Institute of Technology |
. |
. |
. |
1 |
8 |
9 |
| United States-University of Wisconsin - Madison |
. |
. |
3 |
1 |
5 |
9 |
| Italy-UNIV REGGIO CALABRIA |
6 |
2 |
. |
. |
. |
8 |
| Japan-Hokkaido University |
2 |
5 |
1 |
. |
. |
8 |
| Japan-Osaka University |
. |
6 |
. |
1 |
1 |
8 |
| Russian Federation-Russian Academy of Sciences |
. |
2 |
1 |
. |
5 |
8 |
| Taiwan-NATL TAIWAN NORMAL UNIV |
4 |
1 |
. |
1 |
2 |
8 |
| United States-Louisiana State University |
1 |
. |
1 |
4 |
2 |
8 |
| United States-SANDIA NATL LABS |
. |
2 |
3 |
2 |
1 |
8 |
| United States-University of California, Irvine |
. |
. |
. |
. |
8 |
8 |
| United States-University of Kentucky |
1 |
5 |
1 |
. |
1 |
8 |
| United States-Virginia Polytechnic Institute and State University |
2 |
2 |
3 |
1 |
. |
8 |
| Australia-RMIT UNIV |
. |
. |
3 |
4 |
. |
7 |
| Australia-Univ S Australia |
. |
. |
. |
5 |
2 |
7 |
| Japan-University of Tokyo |
. |
5 |
. |
. |
2 |
7 |
| Spain-Spanish National Research Council |
1 |
. |
. |
4 |
2 |
7 |
| United States-Arizona State University |
. |
. |
2 |
1 |
4 |
7 |
| United States-SO ILLINOIS UNIV |
4 |
1 |
. |
1 |
1 |
7 |
| United States-University of Kansas |
. |
. |
. |
. |
7 |
7 |
| China-Sun Yat-sen University |
. |
. |
. |
. |
6 |
6 |
| Finland-University of Turku |
. |
2 |
3 |
1 |
. |
6 |
| France-INST MAX VON LAUE PAUL LANGEVIN |
4 |
1 |
. |
. |
1 |
6 |
| Germany-Ruhr-Universität Bochum |
. |
. |
1 |
3 |
2 |
6 |
| Germany-UNIV CONSTANCE |
6 |
. |
. |
. |
. |
6 |
| Korea, Republic of-AGCY DEF DEV |
. |
. |
. |
. |
6 |
6 |
| Singapore-Nanyang Technological University |
. |
. |
. |
2 |
4 |
6 |
| Taiwan-NATIONAL TAIWAN UNIVERSITY OF SCIENCE & TECHNOLOGY |
5 |
1 |
. |
. |
. |
6 |
| United Kingdom-University College London |
. |
. |
1 |
3 |
2 |
6 |
| United Kingdom-University of Cambridge |
. |
2 |
. |
1 |
3 |
6 |
| United Kingdom-University of Oxford |
. |
1 |
1 |
1 |
3 |
6 |
| United States-Carnegie Mellon University |
. |
. |
1 |
4 |
1 |
6 |
| United States-Iowa State University |
. |
. |
1 |
1 |
4 |
6 |
| United States-University of Delaware |
. |
. |
2 |
2 |
2 |
6 |
| Australia-University of Melbourne |
. |
. |
. |
3 |
2 |
5 |
| China-S CHINA UNIV OF TECHNOL |
. |
. |
. |
2 |
3 |
5 |
| China-Tsinghua University |
. |
. |
. |
5 |
. |
5 |
| France-Atomic Energy and Alternative Energies Commission |
. |
. |
1 |
4 |
. |
5 |
| France-UNIV NANCY 1 |
. |
2 |
3 |
. |
. |
5 |
| Germany-KARL WINNACKER INST DECHEMA EV |
. |
. |
. |
5 |
. |
5 |
| Japan-Kyoto University |
. |
. |
2 |
. |
3 |
5 |
| Japan-National Institute of Advanced Industrial Science and Technology |
. |
. |
. |
3 |
2 |
5 |
| Netherlands-Delft University of Technology |
. |
3 |
2 |
. |
. |
5 |
| Romania-UNIV CRAIOVA |
. |
. |
1 |
2 |
2 |
5 |
| Singapore-National University of Singapore |
. |
. |
2 |
3 |
. |
5 |
| Sri Lanka-INST FUNDAMENTAL STUDIES |
. |
. |
. |
2 |
3 |
5 |
| Taiwan-National Taiwan University |
1 |
. |
. |
1 |
3 |
5 |
| United Kingdom-SERC |
1 |
2 |
2 |
. |
. |
5 |
| United States-BROOKHAVEN NATL LAB |
1 |
. |
1 |
1 |
2 |
5 |
| United States-Johns Hopkins University |
. |
. |
1 |
4 |
. |
5 |
| United States-NATL RENEWABLE ENERGY LAB |
. |
. |
. |
. |
5 |
5 |
| United States-Sierra Nevada Consulting |
. |
. |
. |
5 |
. |
5 |
| United States-US Nanocorp Inc |
. |
1 |
2 |
2 |
. |
5 |
| United States-Vanderbilt University |
. |
. |
. |
5 |
. |
5 |
| Australia-CURTIN UNIV TECHNOL |
. |
. |
1 |
2 |
1 |
4 |
| Canada-LAURENTIAN UNIV |
. |
1 |
. |
2 |
1 |
4 |
| China-ANHUI UNIV |
. |
. |
. |
1 |
3 |
4 |
| China-FUZHOU UNIV |
. |
. |
. |
. |
4 |
4 |
| China-GUANGZHOU UNIVERSITY |
. |
. |
. |
3 |
1 |
4 |
| China-HEFEI UNIV TECHNOL |
. |
. |
. |
2 |
2 |
4 |
| China-Zhejiang Sci Tech Univ |
. |
. |
. |
1 |
3 |
4 |
| China-ZHEJIANG UNIV TECHNOL |
. |
. |
. |
2 |
2 |
4 |
| France-ASB Aerospatiale Batteries |
. |
. |
. |
4 |
. |
4 |
| France-CEN |
4 |
. |
. |
. |
. |
4 |
| France-French National Centre for Scientific Research |
. |
1 |
3 |
. |
. |
4 |
| France-University of Nantes |
. |
. |
1 |
2 |
1 |
4 |
| Germany-University of Freiburg |
4 |
. |
. |
. |
. |
4 |
| Germany-University of Münster |
. |
2 |
2 |
. |
. |
4 |
| India-Bengal Engn & Sci Univ |
. |
. |
. |
. |
4 |
4 |
| India-Indian Assoc Cultivat Sci |
. |
. |
2 |
2 |
. |
4 |
| India-Jadavpur Univ |
. |
. |
. |
. |
4 |
4 |
| Italy-University of Calabria |
2 |
2 |
. |
. |
. |
4 |
| Japan-NAGOYA INSTITUTE OF TECHNOLOGY |
. |
1 |
. |
1 |
2 |
4 |
| Japan-SHIZUOKA UNIV |
. |
. |
4 |
. |
. |
4 |
| Japan-TOHOKU GAKUIN UNIV |
. |
4 |
. |
. |
. |
4 |
| Republic of Serbia-University of Belgrade |
. |
. |
. |
1 |
3 |
4 |
| United Kingdom-Cardiff University |
. |
. |
. |
3 |
1 |
4 |
| United Kingdom-UNIV WALES COLL CARDIFF |
2 |
. |
2 |
. |
. |
4 |
| United States-PACIFIC NW NATL LAB |
. |
. |
3 |
1 |
. |
4 |
| United States-Stanford University |
. |
. |
3 |
. |
1 |
4 |
| United States-University of Colorado Boulder |
. |
. |
. |
. |
4 |
4 |
| United States-University of Pittsburgh |
. |
. |
. |
4 |
. |
4 |
| United States-University of Washington |
. |
. |
1 |
. |
3 |
4 |