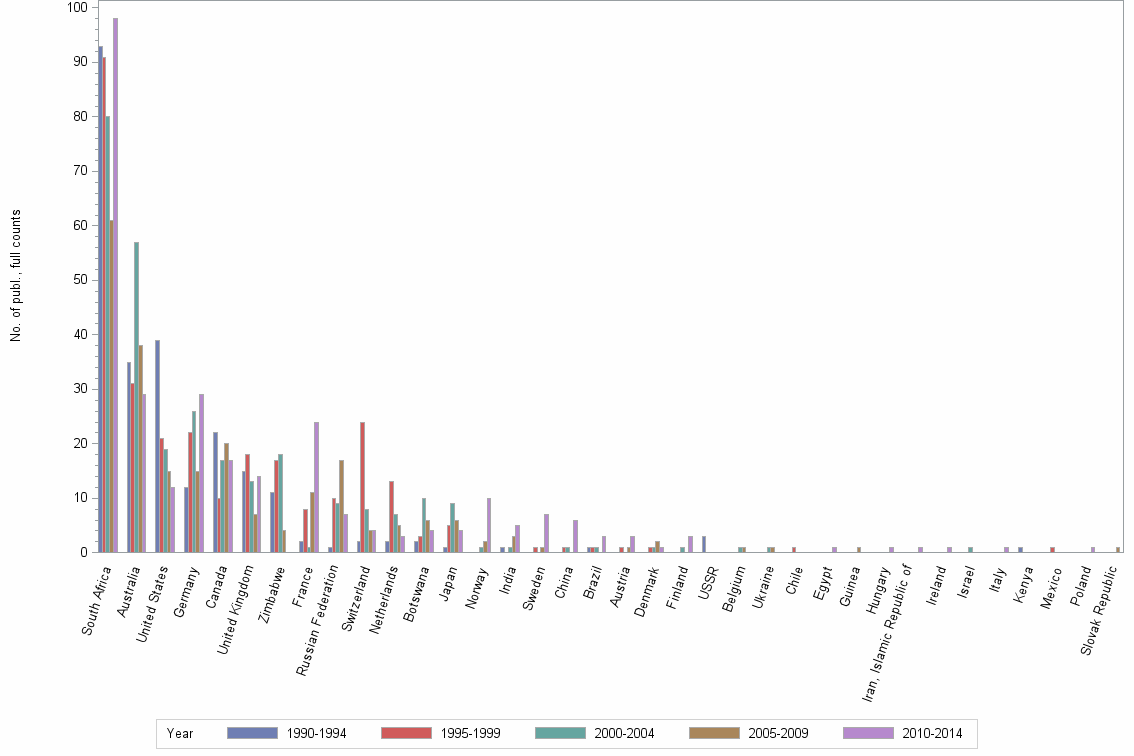
Lev1: LIMPOPO BELT//KAAPVAAL CRATON//PILBARA CRATON - Statistics for Countries

Statistics per Country

Number of publications, full counts

Obs Country 1990-1994 1995-1999 2000-2004 2005-2009 2010-2014 All years
1 All countries 186 202 176 119 155 838
2 South Africa 93 91 80 61 98 423
3 Australia 35 31 57 38 29 190
4 United States 39 21 19 15 12 106
5 Germany 12 22 26 15 29 104
6 Canada 22 10 17 20 17 86
7 United Kingdom 15 18 13 7 14 67
8 Zimbabwe 11 17 18 4 . 50
9 France 2 8 1 11 24 46
10 Russian Federation 1 10 9 17 7 44
11 Switzerland 2 24 8 4 4 42
12 Netherlands 2 13 7 5 3 30
13 Botswana 2 3 10 6 4 25
14 Japan 1 5 9 6 4 25
15 Norway . . 1 2 10 13
16 India 1 . 1 3 5 10
17 Sweden . 1 . 1 7 9
18 China . 1 1 . 6 8
19 Brazil 1 1 1 . 3 6
20 Austria . 1 . 1 3 5
21 Denmark . 1 1 2 1 5
22 Finland . . 1 . 3 4
23 USSR 3 . . . . 3
24 Belgium . . 1 1 . 2
25 Ukraine . . 1 1 . 2
26 Chile . 1 . . . 1
27 Egypt . . . . 1 1
28 Guinea . . . 1 . 1
29 Hungary . . . . 1 1
30 Iran, Islamic Republic of . . . . 1 1
31 Ireland . . . . 1 1
32 Israel . . 1 . . 1
33 Italy . . . . 1 1
34 Kenya 1 . . . . 1
35 Mexico . 1 . . . 1
36 Poland . . . . 1 1
37 Slovak Republic . . . 1 . 1

Number of publications, full counts


Bar chart of publication_year

Share of the total number of publications in the field, full counts (%)

Obs Country 1990-1994 1995-1999 2000-2004 2005-2009 2010-2014 All years
1 All countries 100.0 100.0 100.0 100.0 100.0 100.0
2 South Africa 50.0 45.0 45.5 51.3 63.2 50.5
3 Australia 18.8 15.3 32.4 31.9 18.7 22.7
4 United States 21.0 10.4 10.8 12.6 7.7 12.6
5 Germany 6.5 10.9 14.8 12.6 18.7 12.4
6 Canada 11.8 5.0 9.7 16.8 11.0 10.3
7 United Kingdom 8.1 8.9 7.4 5.9 9.0 8.0
8 Zimbabwe 5.9 8.4 10.2 3.4 . 6.0
9 France 1.1 4.0 0.6 9.2 15.5 5.5
10 Russian Federation 0.5 5.0 5.1 14.3 4.5 5.3
11 Switzerland 1.1 11.9 4.5 3.4 2.6 5.0
12 Netherlands 1.1 6.4 4.0 4.2 1.9 3.6
13 Botswana 1.1 1.5 5.7 5.0 2.6 3.0
14 Japan 0.5 2.5 5.1 5.0 2.6 3.0
15 Norway . . 0.6 1.7 6.5 1.6
16 India 0.5 . 0.6 2.5 3.2 1.2
17 Sweden . 0.5 . 0.8 4.5 1.1
18 China . 0.5 0.6 . 3.9 1.0
19 Brazil 0.5 0.5 0.6 . 1.9 0.7
20 Austria . 0.5 . 0.8 1.9 0.6
21 Denmark . 0.5 0.6 1.7 0.6 0.6
22 Finland . . 0.6 . 1.9 0.5
23 USSR 1.6 . . . . 0.4
24 Belgium . . 0.6 0.8 . 0.2
25 Ukraine . . 0.6 0.8 . 0.2
26 Chile . 0.5 . . . 0.1
27 Egypt . . . . 0.6 0.1
28 Guinea . . . 0.8 . 0.1
29 Hungary . . . . 0.6 0.1
30 Iran, Islamic Republic of . . . . 0.6 0.1
31 Ireland . . . . 0.6 0.1
32 Israel . . 0.6 . . 0.1
33 Italy . . . . 0.6 0.1
34 Kenya 0.5 . . . . 0.1
35 Mexico . 0.5 . . . 0.1
36 Poland . . . . 0.6 0.1
37 Slovak Republic . . . 0.8 . 0.1

Share of the total number of publications in the field, full counts (%)


Bar chart of publication_year

Number of publications among 10% most cited in field, full counts

Obs Country 1990-1994 1995-1999 2000-2004 2005-2009 2010-2014 All years
1 All countries 20.8 23.3 11.6 13.5 13.3 82.4
2 South Africa 9.3 8.8 5.1 6.0 10.3 39.4
3 Australia 10.1 5.0 6.1 7.0 3.0 31.2
4 United States 3.0 4.0 3.0 1.0 2.2 13.2
5 Germany 0.5 6.0 1.0 1.5 2.8 11.8
6 Canada 3.0 2.0 2.0 1.0 3.0 11.0
7 United Kingdom 3.0 3.0 1.0 1.0 0.0 8.0
8 Zimbabwe 1.0 2.5 1.0 0.0 . 4.5
9 France 0.0 0.5 0.0 2.0 1.1 3.6
10 Russian Federation 0.0 0.0 0.0 0.0 0.0 0.0
11 Switzerland 0.0 5.0 2.0 0.0 0.0 7.0
12 Netherlands 0.0 2.3 0.0 0.0 0.0 2.3
13 Botswana 0.0 0.0 0.0 0.0 1.0 1.0
14 Japan 0.0 1.0 0.0 0.0 0.0 1.0
15 Norway . . 0.0 0.0 1.0 1.0
16 India 0.0 . 0.0 0.0 0.0 0.0
17 Sweden . 1.0 . 0.0 3.0 4.0
18 China . 0.0 0.0 . 1.0 1.0
19 Brazil 0.0 0.0 0.0 . 0.0 0.0
20 Austria . 0.0 . 0.0 0.0 0.0
21 Denmark . 1.0 0.0 0.0 0.0 1.0
22 Finland . . 0.0 . 0.0 0.0
23 USSR 0.0 . . . . 0.0
24 Belgium . . 0.0 0.0 . 0.0
25 Ukraine . . 0.0 0.0 . 0.0
26 Chile . 0.0 . . . 0.0
27 Egypt . . . . 0.0 0.0
28 Guinea . . . 0.0 . 0.0
29 Hungary . . . . 0.0 0.0
30 Iran, Islamic Republic of . . . . 0.0 0.0
31 Ireland . . . . 0.0 0.0
32 Israel . . 0.0 . . 0.0
33 Italy . . . . 0.0 0.0
34 Kenya 0.0 . . . . 0.0
35 Mexico . 0.0 . . . 0.0
36 Poland . . . . 0.0 0.0
37 Slovak Republic . . . 0.0 . 0.0

Number of publications among 10% most cited in field, full counts


Bar chart of publication_year

Share of publications among 10% most cited in field, fractionalized (%)

Obs Country 1990-1994 1995-1999 2000-2004 2005-2009 2010-2014 All years
1 All countries 11.2 11.5 6.6 11.3 8.6 9.8
2 South Africa 8.5 6.3 5.4 12.1 8.8 7.8
3 Australia 23.4 11.5 10.2 26.6 9.9 15.8
4 United States 6.8 11.8 19.0 7.0 14.6 10.7
5 Germany 3.7 21.7 2.5 16.8 12.7 11.9
6 Canada 15.5 9.3 11.6 5.6 15.0 11.9
7 United Kingdom 23.9 15.8 2.1 21.1 0.0 12.2
8 Zimbabwe 16.6 15.2 1.9 0.0 . 10.1
9 France 0.0 4.3 0.0 17.0 3.5 6.1
10 Russian Federation 0.0 0.0 0.0 0.0 0.0 0.0
11 Switzerland 0.0 20.3 22.5 0.0 0.0 17.4
12 Netherlands 0.0 16.4 0.0 0.0 0.0 7.7
13 Botswana 0.0 0.0 0.0 0.0 11.6 1.7
14 Japan 0.0 26.1 0.0 0.0 0.0 5.1
15 Norway . . 0.0 0.0 10.7 9.8
16 India 0.0 . 0.0 0.0 0.0 0.0
17 Sweden . 100.0 . 0.0 42.2 55.0
18 China . 0.0 0.0 . 32.7 20.9
19 Brazil 0.0 0.0 0.0 . 0.0 0.0
20 Austria . 0.0 . 0.0 0.0 0.0
21 Denmark . 100.0 0.0 0.0 0.0 5.9
22 Finland . . 0.0 . 0.0 0.0
23 USSR 0.0 . . . . 0.0
24 Belgium . . 0.0 0.0 . 0.0
25 Ukraine . . 0.0 0.0 . 0.0
26 Chile . 0.0 . . . 0.0
27 Egypt . . . . 0.0 0.0
28 Guinea . . . 0.0 . 0.0
29 Hungary . . . . 0.0 0.0
30 Iran, Islamic Republic of . . . . 0.0 0.0
31 Ireland . . . . 0.0 0.0
32 Israel . . 0.0 . . 0.0
33 Italy . . . . 0.0 0.0
34 Kenya 0.0 . . . . 0.0
35 Mexico . 0.0 . . . 0.0
36 Poland . . . . 0.0 0.0
37 Slovak Republic . . . 0.0 . 0.0

Share of publications among 10% most cited in field, fractionalized (%)


Bar chart of publication_year

Field normalized citation rate (cf), fractionalized

Obs Country 1990-1994 1995-1999 2000-2004 2005-2009 2010-2014 All years
1 All countries 1.20 1.12 0.86 0.92 1.00 1.03
2 South Africa 1.10 1.03 0.77 1.02 0.99 1.00
3 Australia 1.72 1.46 1.07 1.39 1.10 1.33
4 United States 0.95 1.14 1.20 0.98 1.06 1.04
5 Germany 0.99 1.46 0.74 1.27 1.36 1.17
6 Canada 1.66 0.79 1.02 0.86 0.90 1.15
7 United Kingdom 1.73 1.25 0.62 0.87 0.59 1.09
8 Zimbabwe 1.45 0.93 0.54 0.23 . 0.86
9 France 0.92 0.81 0.33 1.11 1.23 1.11
10 Russian Federation 0.13 0.16 0.75 0.27 0.40 0.33
11 Switzerland 0.55 1.59 1.56 0.60 1.00 1.44
12 Netherlands 1.17 0.95 0.45 0.58 0.51 0.74
13 Botswana 0.12 0.32 0.63 0.56 0.64 0.53
14 Japan 1.78 1.42 0.92 0.38 0.42 0.83
15 Norway . . 0.99 0.77 1.10 1.07
16 India 1.84 . 0.82 0.62 0.80 0.83
17 Sweden . 2.56 . 0.60 1.58 1.77
18 China . 0.00 0.00 . 1.82 1.16
19 Brazil 0.60 0.27 0.82 . 0.18 0.29
20 Austria . 0.72 . 0.52 1.08 0.89
21 Denmark . 1.17 0.17 0.59 0.31 0.46
22 Finland . . 0.17 . 0.12 0.13
23 USSR 0.22 . . . . 0.22
24 Belgium . . 0.28 0.69 . 0.39
25 Ukraine . . 0.04 0.11 . 0.08
26 Chile . 0.30 . . . 0.30
27 Egypt . . . . 1.86 1.86
28 Guinea . . . 0.52 . 0.52
29 Hungary . . . . 0.09 0.09
30 Iran, Islamic Republic of . . . . 0.10 0.10
31 Ireland . . . . 1.75 1.75
32 Israel . . 0.42 . . 0.42
33 Italy . . . . 1.82 1.82
34 Kenya 0.63 . . . . 0.63
35 Mexico . 0.38 . . . 0.38
36 Poland . . . . 0.62 0.62
37 Slovak Republic . . . 0.52 . 0.52

Field normalized citation rate (cf), fractionalized


Bar chart of publication_year