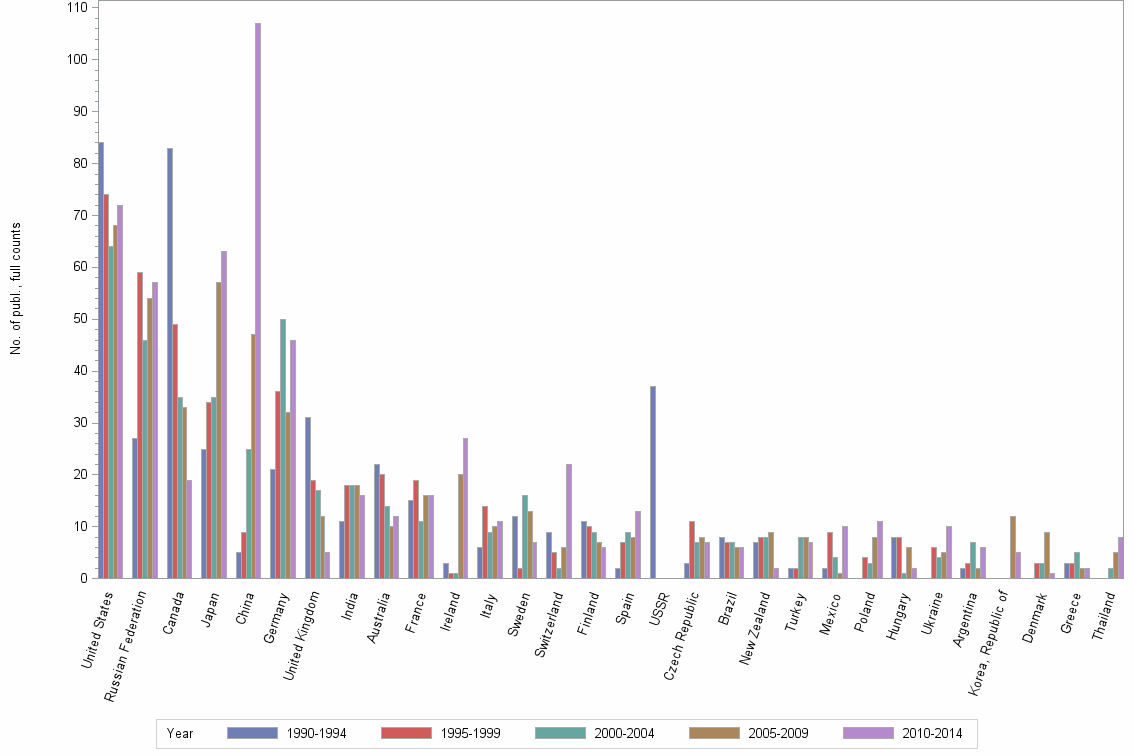
Lev1: MAGNETOTELLURICS//GEOMAGNETIC INDUCTION//GALVANIC DISTORTION - Statistics for Countries

Statistics per Country

Number of publications, full counts

Obs Country 1990-1994 1995-1999 2000-2004 2005-2009 2010-2014 All years
1 All countries 407 356 329 358 448 1898
2 United States 84 74 64 68 72 362
3 Russian Federation 27 59 46 54 57 243
4 Canada 83 49 35 33 19 219
5 Japan 25 34 35 57 63 214
6 China 5 9 25 47 107 193
7 Germany 21 36 50 32 46 185
8 United Kingdom 31 19 17 12 5 84
9 India 11 18 18 18 16 81
10 Australia 22 20 14 10 12 78
11 France 15 19 11 16 16 77
12 Ireland 3 1 1 20 27 52
13 Italy 6 14 9 10 11 50
14 Sweden 12 2 16 13 7 50
15 Switzerland 9 5 2 6 22 44
16 Finland 11 10 9 7 6 43
17 Spain 2 7 9 8 13 39
18 USSR 37 . . . . 37
19 Czech Republic 3 11 7 8 7 36
20 Brazil 8 7 7 6 6 34
21 New Zealand 7 8 8 9 2 34
22 Turkey 2 2 8 8 7 27
23 Mexico 2 9 4 1 10 26
24 Poland . 4 3 8 11 26
25 Hungary 8 8 1 6 2 25
26 Ukraine . 6 4 5 10 25
27 Argentina 2 3 7 2 6 20
28 Korea, Republic of . . . 12 5 17
29 Denmark . 3 3 9 1 16
30 Greece 3 3 5 2 2 15
31 Thailand . . 2 5 8 15
32 Czechoslovakia 13 . . . . 13
33 Portugal . . 6 6 1 13
34 Taiwan . 1 3 4 4 12
35 Indonesia . 3 1 1 2 7
36 Iran, Islamic Republic of . . . 1 6 7
37 South Africa . . . 4 3 7
38 Kyrgyz Republic . . 1 1 4 6
39 Netherlands 1 . 1 2 2 6
40 Norway 1 . . 2 3 6
41 Nigeria 2 1 . . 2 5
42 Egypt . . 1 1 2 4
43 Hong Kong 2 2 . . . 4
44 Senegal 1 2 1 . . 4
45 Slovak Republic . . . 2 2 4
46 Austria 1 . . 1 1 3
47 Cameroon 1 . . 1 1 3
48 Gambia 3 . . . . 3
49 Namibia . . . 2 1 3
50 Zimbabwe 1 . 2 . . 3
51 Botswana . . . 2 . 2
52 Iceland 1 . . . 1 2
53 Israel 1 1 . . . 2
54 Romania 1 1 . . . 2
55 Viet Nam . . . . 2 2

Number of publications, full counts


Bar chart of publication_year

Share of the total number of publications in the field, full counts (%)

Obs Country 1990-1994 1995-1999 2000-2004 2005-2009 2010-2014 All years
1 All countries 100.0 100.0 100.0 100.0 100.0 100.0
2 United States 20.6 20.8 19.5 19.0 16.1 19.1
3 Russian Federation 6.6 16.6 14.0 15.1 12.7 12.8
4 Canada 20.4 13.8 10.6 9.2 4.2 11.5
5 Japan 6.1 9.6 10.6 15.9 14.1 11.3
6 China 1.2 2.5 7.6 13.1 23.9 10.2
7 Germany 5.2 10.1 15.2 8.9 10.3 9.7
8 United Kingdom 7.6 5.3 5.2 3.4 1.1 4.4
9 India 2.7 5.1 5.5 5.0 3.6 4.3
10 Australia 5.4 5.6 4.3 2.8 2.7 4.1
11 France 3.7 5.3 3.3 4.5 3.6 4.1
12 Ireland 0.7 0.3 0.3 5.6 6.0 2.7
13 Italy 1.5 3.9 2.7 2.8 2.5 2.6
14 Sweden 2.9 0.6 4.9 3.6 1.6 2.6
15 Switzerland 2.2 1.4 0.6 1.7 4.9 2.3
16 Finland 2.7 2.8 2.7 2.0 1.3 2.3
17 Spain 0.5 2.0 2.7 2.2 2.9 2.1
18 USSR 9.1 . . . . 1.9
19 Czech Republic 0.7 3.1 2.1 2.2 1.6 1.9
20 Brazil 2.0 2.0 2.1 1.7 1.3 1.8
21 New Zealand 1.7 2.2 2.4 2.5 0.4 1.8
22 Turkey 0.5 0.6 2.4 2.2 1.6 1.4
23 Mexico 0.5 2.5 1.2 0.3 2.2 1.4
24 Poland . 1.1 0.9 2.2 2.5 1.4
25 Hungary 2.0 2.2 0.3 1.7 0.4 1.3
26 Ukraine . 1.7 1.2 1.4 2.2 1.3
27 Argentina 0.5 0.8 2.1 0.6 1.3 1.1
28 Korea, Republic of . . . 3.4 1.1 0.9
29 Denmark . 0.8 0.9 2.5 0.2 0.8
30 Greece 0.7 0.8 1.5 0.6 0.4 0.8
31 Thailand . . 0.6 1.4 1.8 0.8
32 Czechoslovakia 3.2 . . . . 0.7
33 Portugal . . 1.8 1.7 0.2 0.7
34 Taiwan . 0.3 0.9 1.1 0.9 0.6
35 Indonesia . 0.8 0.3 0.3 0.4 0.4
36 Iran, Islamic Republic of . . . 0.3 1.3 0.4
37 South Africa . . . 1.1 0.7 0.4
38 Kyrgyz Republic . . 0.3 0.3 0.9 0.3
39 Netherlands 0.2 . 0.3 0.6 0.4 0.3
40 Norway 0.2 . . 0.6 0.7 0.3
41 Nigeria 0.5 0.3 . . 0.4 0.3
42 Egypt . . 0.3 0.3 0.4 0.2
43 Hong Kong 0.5 0.6 . . . 0.2
44 Senegal 0.2 0.6 0.3 . . 0.2
45 Slovak Republic . . . 0.6 0.4 0.2
46 Austria 0.2 . . 0.3 0.2 0.2
47 Cameroon 0.2 . . 0.3 0.2 0.2
48 Gambia 0.7 . . . . 0.2
49 Namibia . . . 0.6 0.2 0.2
50 Zimbabwe 0.2 . 0.6 . . 0.2
51 Botswana . . . 0.6 . 0.1
52 Iceland 0.2 . . . 0.2 0.1
53 Israel 0.2 0.3 . . . 0.1
54 Romania 0.2 0.3 . . . 0.1
55 Viet Nam . . . . 0.4 0.1

Share of the total number of publications in the field, full counts (%)


Bar chart of publication_year

Number of publications among 10% most cited in field, full counts

Obs Country 1990-1994 1995-1999 2000-2004 2005-2009 2010-2014 All years
1 All countries 22.4 11.5 11.8 18.8 29.4 94.0
2 United States 16.0 7.5 9.1 10.7 18.6 61.8
3 Russian Federation 0.0 0.5 0.0 0.0 0.0 0.5
4 Canada 4.8 1.5 4.3 1.5 1.7 13.7
5 Japan 1.0 0.5 1.0 7.6 2.4 12.5
6 China 0.0 0.0 0.0 2.0 1.0 3.0
7 Germany 2.0 1.5 2.0 1.5 8.3 15.3
8 United Kingdom 3.1 2.0 0.0 0.0 1.3 6.4
9 India 0.0 0.0 0.0 0.0 0.0 0.0
10 Australia 0.0 0.5 0.0 0.5 1.1 2.1
11 France 0.0 1.0 0.0 1.0 4.5 6.5
12 Ireland 0.0 0.0 1.0 0.5 1.8 3.3
13 Italy 0.0 0.0 0.0 1.5 1.0 2.5
14 Sweden 0.0 0.0 0.0 0.5 0.0 0.5
15 Switzerland 0.5 0.5 0.0 0.0 1.0 2.0
16 Finland 0.0 0.0 0.0 0.0 0.0 0.0
17 Spain 0.0 0.0 0.0 0.0 0.3 0.3
18 USSR 0.0 . . . . 0.0
19 Czech Republic 0.0 0.0 0.0 0.0 0.0 0.0
20 Brazil 0.1 0.0 0.0 0.0 0.0 0.1
21 New Zealand 0.0 0.0 1.0 2.0 0.0 3.0
22 Turkey 0.0 0.0 0.0 0.0 0.0 0.0
23 Mexico 0.0 0.0 0.0 0.0 0.0 0.0
24 Poland . 0.0 0.0 0.0 0.0 0.0
25 Hungary 0.0 0.0 0.0 0.0 0.0 0.0
26 Ukraine . 0.0 0.0 0.0 0.0 0.0
27 Argentina 0.0 0.0 0.5 0.0 0.0 0.5
28 Korea, Republic of . . . 0.0 0.0 0.0
29 Denmark . 1.0 0.0 1.0 0.0 2.0
30 Greece 0.0 0.0 0.0 0.0 0.0 0.0
31 Thailand . . 0.0 1.4 1.0 2.4
32 Czechoslovakia 0.0 . . . . 0.0
33 Portugal . . 0.0 0.0 0.0 0.0
34 Taiwan . 0.0 0.0 0.0 0.0 0.0
35 Indonesia . 0.0 0.0 0.0 0.0 0.0
36 Iran, Islamic Republic of . . . 0.0 0.0 0.0
37 South Africa . . . 0.5 0.0 0.5
38 Kyrgyz Republic . . 0.0 0.0 0.0 0.0
39 Netherlands 0.0 . 0.0 0.0 0.0 0.0
40 Norway 0.0 . . 0.0 1.0 1.0
41 Nigeria 0.0 0.0 . . 0.0 0.0
42 Egypt . . 0.0 0.0 0.0 0.0
43 Hong Kong 0.0 0.0 . . . 0.0
44 Senegal 0.0 0.0 0.0 . . 0.0
45 Slovak Republic . . . 0.0 0.0 0.0
46 Austria 0.0 . . 0.0 0.0 0.0
47 Cameroon 0.0 . . 0.0 0.0 0.0
48 Gambia 0.0 . . . . 0.0
49 Namibia . . . 0.5 0.0 0.5
50 Zimbabwe 0.0 . 0.0 . . 0.0
51 Botswana . . . 0.5 . 0.5
52 Iceland 0.0 . . . 0.5 0.5
53 Israel 0.0 0.5 . . . 0.5
54 Romania 0.0 0.0 . . . 0.0
55 Viet Nam . . . . 0.0 0.0

Number of publications among 10% most cited in field, full counts


Bar chart of publication_year

Share of publications among 10% most cited in field, fractionalized (%)

Obs Country 1990-1994 1995-1999 2000-2004 2005-2009 2010-2014 All years
1 All countries 5.5 3.2 3.6 5.3 6.6 5.0
2 United States 18.7 11.3 14.0 17.3 25.5 17.5
3 Russian Federation 0.0 0.5 0.0 0.0 0.0 0.1
4 Canada 5.6 3.6 11.3 4.9 6.1 6.0
5 Japan 4.3 0.6 2.3 10.2 1.9 4.3
6 China 0.0 0.0 0.0 2.4 0.5 0.9
7 Germany 8.5 4.2 2.1 3.2 20.0 7.6
8 United Kingdom 6.2 5.9 0.0 0.0 21.5 4.9
9 India 0.0 0.0 0.0 0.0 0.0 0.0
10 Australia 0.0 0.5 0.0 0.6 13.4 2.1
11 France 0.0 1.2 0.0 8.9 22.1 6.4
12 Ireland 0.0 0.0 100.0 0.7 6.0 5.0
13 Italy 0.0 0.0 0.0 8.2 13.0 3.8
14 Sweden 0.0 0.0 0.0 0.5 0.0 0.1
15 Switzerland 6.4 2.9 0.0 0.0 3.5 3.6
16 Finland 0.0 0.0 0.0 0.0 0.0 0.0
17 Spain 0.0 0.0 0.0 0.0 1.1 0.3
18 USSR 0.0 . . . . 0.0
19 Czech Republic 0.0 0.0 0.0 0.0 0.0 0.0
20 Brazil 0.9 0.0 0.0 0.0 0.0 0.2
21 New Zealand 0.0 0.0 9.5 22.2 0.0 7.2
22 Turkey 0.0 0.0 0.0 0.0 0.0 0.0
23 Mexico 0.0 0.0 0.0 0.0 0.0 0.0
24 Poland . 0.0 0.0 0.0 0.0 0.0
25 Hungary 0.0 0.0 0.0 0.0 0.0 0.0
26 Ukraine . 0.0 0.0 0.0 0.0 0.0
27 Argentina 0.0 0.0 6.2 0.0 0.0 2.1
28 Korea, Republic of . . . 0.0 0.0 0.0
29 Denmark . 33.3 0.0 23.8 0.0 21.4
30 Greece 0.0 0.0 0.0 0.0 0.0 0.0
31 Thailand . . 0.0 31.5 18.6 19.7
32 Czechoslovakia 0.0 . . . . 0.0
33 Portugal . . 0.0 0.0 0.0 0.0
34 Taiwan . 0.0 0.0 0.0 0.0 0.0
35 Indonesia . 0.0 0.0 0.0 0.0 0.0
36 Iran, Islamic Republic of . . . 0.0 0.0 0.0
37 South Africa . . . 11.5 0.0 6.7
38 Kyrgyz Republic . . 0.0 0.0 0.0 0.0
39 Netherlands 0.0 . 0.0 0.0 0.0 0.0
40 Norway 0.0 . . 0.0 14.3 9.0
41 Nigeria 0.0 0.0 . . 0.0 0.0
42 Egypt . . 0.0 0.0 0.0 0.0
43 Hong Kong 0.0 0.0 . . . 0.0
44 Senegal 0.0 0.0 0.0 . . 0.0
45 Slovak Republic . . . 0.0 0.0 0.0
46 Austria 0.0 . . 0.0 0.0 0.0
47 Cameroon 0.0 . . 0.0 0.0 0.0
48 Gambia 0.0 . . . . 0.0
49 Namibia . . . 22.9 0.0 12.4
50 Zimbabwe 0.0 . 0.0 . . 0.0
51 Botswana . . . 22.9 . 22.9
52 Iceland 0.0 . . . 50.0 25.0
53 Israel 0.0 50.0 . . . 13.6
54 Romania 0.0 0.0 . . . 0.0
55 Viet Nam . . . . 0.0 0.0

Share of publications among 10% most cited in field, fractionalized (%)


Bar chart of publication_year

Field normalized citation rate (cf), fractionalized

Obs Country 1990-1994 1995-1999 2000-2004 2005-2009 2010-2014 All years
1 All countries 0.61 0.48 0.61 0.71 0.74 0.63
2 United States 1.47 1.02 1.44 1.42 1.63 1.40
3 Russian Federation 0.12 0.15 0.21 0.11 0.10 0.14
4 Canada 0.66 0.60 1.01 0.73 0.87 0.72
5 Japan 0.48 0.43 0.63 0.99 0.82 0.72
6 China 0.20 0.12 0.28 0.54 0.45 0.43
7 Germany 1.06 0.79 0.68 0.74 1.37 0.92
8 United Kingdom 0.69 0.70 0.63 0.29 2.03 0.67
9 India 0.13 0.19 0.14 0.42 0.27 0.24
10 Australia 0.29 0.31 0.33 0.47 1.21 0.45
11 France 0.26 0.38 0.36 1.08 1.82 0.77
12 Ireland 0.42 0.23 6.70 0.88 0.94 0.96
13 Italy 0.08 0.23 0.40 0.97 1.21 0.55
14 Sweden 0.21 0.11 0.36 0.76 0.61 0.43
15 Switzerland 0.79 0.18 0.18 0.52 1.01 0.75
16 Finland 0.48 0.33 0.31 1.02 0.41 0.48
17 Spain 0.05 0.32 0.67 0.86 0.71 0.64
18 USSR 0.11 . . . . 0.11
19 Czech Republic 0.06 0.28 0.30 0.41 0.88 0.40
20 Brazil 0.34 0.13 0.17 0.30 0.87 0.36
21 New Zealand 0.37 0.13 1.06 1.40 0.49 0.70
22 Turkey 0.13 0.24 0.42 0.54 0.32 0.39
23 Mexico 0.40 0.23 0.23 0.27 0.16 0.22
24 Poland . 0.15 0.10 0.36 0.23 0.23
25 Hungary 0.07 0.22 0.26 0.16 0.00 0.14
26 Ukraine . 0.11 0.02 0.24 0.05 0.09
27 Argentina 0.20 0.13 0.59 0.13 0.35 0.36
28 Korea, Republic of . . . 0.37 0.17 0.31
29 Denmark . 1.78 0.85 1.41 1.27 1.42
30 Greece 0.06 0.22 0.03 0.17 0.20 0.11
31 Thailand . . 0.93 2.26 0.79 1.18
32 Czechoslovakia 0.26 . . . . 0.26
33 Portugal . . 0.29 0.69 0.00 0.42
34 Taiwan . 0.27 0.20 0.06 0.21 0.15
35 Indonesia . 0.21 0.28 0.06 0.49 0.24
36 Iran, Islamic Republic of . . . 0.45 0.43 0.43
37 South Africa . . . 1.33 0.90 1.15
38 Kyrgyz Republic . . 0.17 0.07 0.01 0.06
39 Netherlands 0.04 . 1.31 1.27 0.72 0.97
40 Norway 0.12 . . 0.74 0.69 0.60
41 Nigeria 0.10 0.06 . . 0.21 0.14
42 Egypt . . 1.24 0.23 0.13 0.46
43 Hong Kong 0.16 0.00 . . . 0.08
44 Senegal 0.00 0.27 0.85 . . 0.36
45 Slovak Republic . . . 0.39 0.41 0.40
46 Austria 0.25 . . 0.06 0.30 0.21
47 Cameroon 0.04 . . 0.00 0.00 0.01
48 Gambia 0.07 . . . . 0.07
49 Namibia . . . 1.65 2.22 1.91
50 Zimbabwe 0.09 . 0.09 . . 0.09
51 Botswana . . . 1.65 . 1.65
52 Iceland 0.09 . . . 2.11 1.10
53 Israel 0.80 1.89 . . . 1.10
54 Romania 0.12 0.06 . . . 0.08
55 Viet Nam . . . . 0.07 0.07

Field normalized citation rate (cf), fractionalized


Bar chart of publication_year