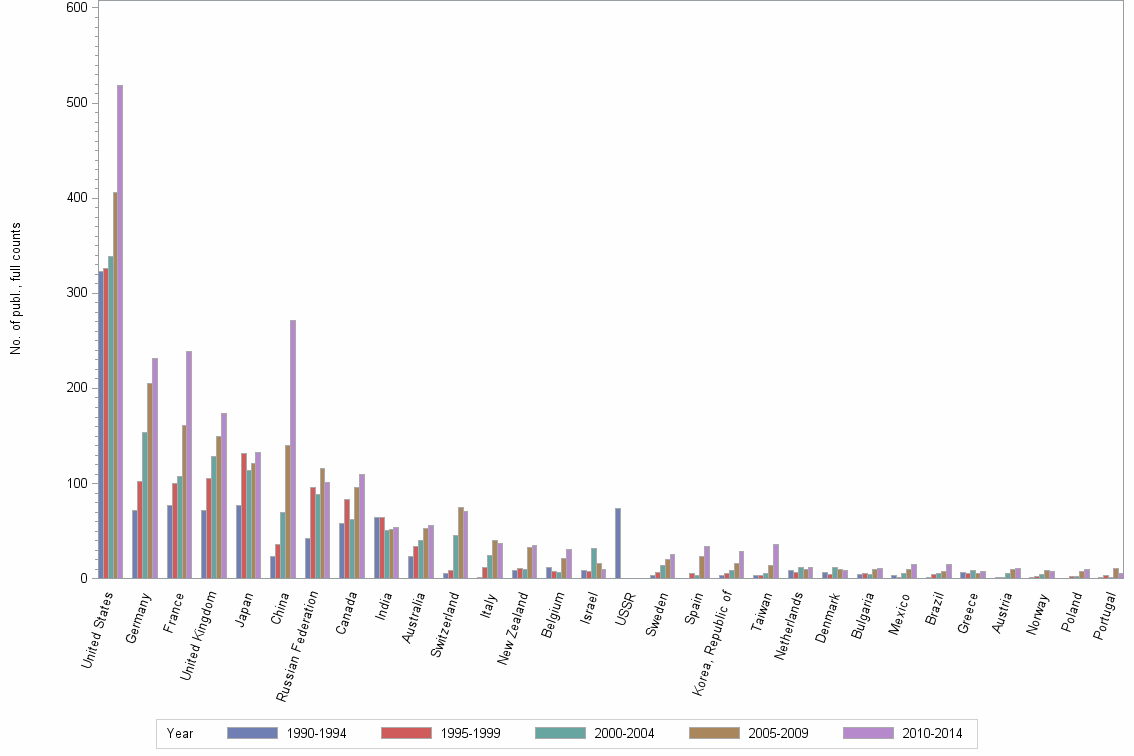
Lev2: FERROMANGANESE CRUSTS//CHEMICAL GEOLOGY//IRON ISOTOPES - Statistics for Countries

Statistics per Country

Number of publications, full counts

Obs Country 1990-1994 1995-1999 2000-2004 2005-2009 2010-2014 All years
1 All countries 836 913 1031 1296 1557 5633
2 United States 323 326 339 406 518 1912
3 Germany 72 102 154 205 232 765
4 France 77 100 107 161 239 684
5 United Kingdom 72 105 129 149 174 629
6 Japan 77 132 114 121 133 577
7 China 23 36 70 140 271 540
8 Russian Federation 42 96 89 116 101 444
9 Canada 58 83 62 96 110 409
10 India 64 64 51 52 54 285
11 Australia 23 34 40 53 56 206
12 Switzerland 6 9 45 75 71 206
13 Italy 1 12 24 40 37 114
14 New Zealand 9 11 10 33 35 98
15 Belgium 12 8 7 21 31 79
16 Israel 9 8 32 16 10 75
17 USSR 74 . . . . 74
18 Sweden 3 7 14 20 26 70
19 Spain . 6 3 23 34 66
20 Korea, Republic of 3 6 9 16 29 63
21 Taiwan 3 3 6 14 36 62
22 Netherlands 9 7 12 10 12 50
23 Denmark 7 4 12 10 9 42
24 Bulgaria 4 6 4 10 11 35
25 Mexico 3 1 6 10 15 35
26 Brazil 1 4 6 8 15 34
27 Greece 7 5 9 5 8 34
28 Austria 1 1 5 10 11 28
29 Norway 1 2 4 9 8 24
30 Poland . 2 2 8 10 22
31 Portugal 1 3 1 11 6 22
32 South Africa 1 1 4 9 5 20
33 Turkey . 4 5 6 3 18
34 Hungary . . 2 11 4 17
35 Iceland . . 1 9 6 16
36 Argentina 3 2 2 3 3 13
37 Czech Republic . . 3 3 7 13
38 Finland 1 . 4 3 5 13
39 Ireland . 3 2 . 4 9
40 Malaysia . . 1 1 6 8
41 Saudi Arabia 1 . . . 7 8
42 Croatia . 1 2 2 2 7
43 Egypt 1 . 2 . 4 7
44 Iran, Islamic Republic of . . . 1 6 7
45 Chile . . 1 3 2 6
46 Slovak Republic . . 2 . 4 6
47 Slovenia . . 3 3 . 6
48 Monaco . . 2 3 . 5
49 Morocco . 1 2 1 1 5
50 New Caledonia . 3 1 . 1 5
51 Papua New Guinea 1 3 . . 1 5
52 Singapore . . . 1 4 5
53 Tunisia . . . 1 4 5

Number of publications, full counts


Bar chart of publication_year

Share of the total number of publications in the field, full counts (%)

Obs Country 1990-1994 1995-1999 2000-2004 2005-2009 2010-2014 All years
1 All countries 100.0 100.0 100.0 100.0 100.0 100.0
2 United States 38.6 35.7 32.9 31.3 33.3 33.9
3 Germany 8.6 11.2 14.9 15.8 14.9 13.6
4 France 9.2 11.0 10.4 12.4 15.4 12.1
5 United Kingdom 8.6 11.5 12.5 11.5 11.2 11.2
6 Japan 9.2 14.5 11.1 9.3 8.5 10.2
7 China 2.8 3.9 6.8 10.8 17.4 9.6
8 Russian Federation 5.0 10.5 8.6 9.0 6.5 7.9
9 Canada 6.9 9.1 6.0 7.4 7.1 7.3
10 India 7.7 7.0 4.9 4.0 3.5 5.1
11 Australia 2.8 3.7 3.9 4.1 3.6 3.7
12 Switzerland 0.7 1.0 4.4 5.8 4.6 3.7
13 Italy 0.1 1.3 2.3 3.1 2.4 2.0
14 New Zealand 1.1 1.2 1.0 2.5 2.2 1.7
15 Belgium 1.4 0.9 0.7 1.6 2.0 1.4
16 Israel 1.1 0.9 3.1 1.2 0.6 1.3
17 USSR 8.9 . . . . 1.3
18 Sweden 0.4 0.8 1.4 1.5 1.7 1.2
19 Spain . 0.7 0.3 1.8 2.2 1.2
20 Korea, Republic of 0.4 0.7 0.9 1.2 1.9 1.1
21 Taiwan 0.4 0.3 0.6 1.1 2.3 1.1
22 Netherlands 1.1 0.8 1.2 0.8 0.8 0.9
23 Denmark 0.8 0.4 1.2 0.8 0.6 0.7
24 Bulgaria 0.5 0.7 0.4 0.8 0.7 0.6
25 Mexico 0.4 0.1 0.6 0.8 1.0 0.6
26 Brazil 0.1 0.4 0.6 0.6 1.0 0.6
27 Greece 0.8 0.5 0.9 0.4 0.5 0.6
28 Austria 0.1 0.1 0.5 0.8 0.7 0.5
29 Norway 0.1 0.2 0.4 0.7 0.5 0.4
30 Poland . 0.2 0.2 0.6 0.6 0.4
31 Portugal 0.1 0.3 0.1 0.8 0.4 0.4
32 South Africa 0.1 0.1 0.4 0.7 0.3 0.4
33 Turkey . 0.4 0.5 0.5 0.2 0.3
34 Hungary . . 0.2 0.8 0.3 0.3
35 Iceland . . 0.1 0.7 0.4 0.3
36 Argentina 0.4 0.2 0.2 0.2 0.2 0.2
37 Czech Republic . . 0.3 0.2 0.4 0.2
38 Finland 0.1 . 0.4 0.2 0.3 0.2
39 Ireland . 0.3 0.2 . 0.3 0.2
40 Malaysia . . 0.1 0.1 0.4 0.1
41 Saudi Arabia 0.1 . . . 0.4 0.1
42 Croatia . 0.1 0.2 0.2 0.1 0.1
43 Egypt 0.1 . 0.2 . 0.3 0.1
44 Iran, Islamic Republic of . . . 0.1 0.4 0.1
45 Chile . . 0.1 0.2 0.1 0.1
46 Slovak Republic . . 0.2 . 0.3 0.1
47 Slovenia . . 0.3 0.2 . 0.1
48 Monaco . . 0.2 0.2 . 0.1
49 Morocco . 0.1 0.2 0.1 0.1 0.1
50 New Caledonia . 0.3 0.1 . 0.1 0.1
51 Papua New Guinea 0.1 0.3 . . 0.1 0.1
52 Singapore . . . 0.1 0.3 0.1
53 Tunisia . . . 0.1 0.3 0.1

Share of the total number of publications in the field, full counts (%)


Bar chart of publication_year

Number of publications among 10% most cited in field, full counts

Obs Country 1990-1994 1995-1999 2000-2004 2005-2009 2010-2014 All years
1 All countries 128.4 119.1 173.9 195.7 234.3 851.4
2 United States 77.5 64.6 88.3 85.7 117.7 433.9
3 Germany 15.6 17.4 31.2 42.7 50.2 157.0
4 France 15.1 20.3 27.5 38.1 55.4 156.3
5 United Kingdom 17.3 23.1 36.4 43.9 54.2 174.9
6 Japan 8.0 11.5 13.0 6.1 11.2 49.8
7 China 0.0 2.5 4.0 6.0 20.3 32.8
8 Russian Federation 1.0 0.0 2.0 2.2 5.3 10.4
9 Canada 8.0 12.8 4.5 12.7 23.9 62.0
10 India 1.3 0.0 0.0 0.0 2.0 3.3
11 Australia 5.3 4.0 11.5 12.9 11.0 44.6
12 Switzerland 1.0 2.0 13.7 20.8 18.9 56.4
13 Italy 0.5 1.0 4.0 0.8 5.0 11.3
14 New Zealand 0.3 1.0 3.0 3.5 9.2 16.9
15 Belgium 2.0 1.5 1.0 5.9 4.7 15.1
16 Israel 4.0 1.0 7.0 2.3 2.5 16.8
17 USSR 0.0 . . . . 0.0
18 Sweden 0.0 1.0 4.5 2.5 1.3 9.3
19 Spain . 2.0 0.0 0.0 4.4 6.4
20 Korea, Republic of 1.0 0.0 1.0 0.0 1.0 3.0
21 Taiwan 0.3 0.0 0.0 0.5 4.9 5.8
22 Netherlands 0.5 1.0 3.0 1.7 5.0 11.2
23 Denmark 0.0 0.0 3.0 0.3 2.5 5.8
24 Bulgaria 0.0 0.0 0.0 0.0 1.0 1.0
25 Mexico 0.0 0.0 0.0 0.0 0.0 0.0
26 Brazil 0.0 0.0 0.0 1.0 1.5 2.5
27 Greece 0.3 1.0 0.0 0.0 0.0 1.3
28 Austria 0.0 0.0 3.0 4.0 3.7 10.7
29 Norway 0.0 0.0 0.0 0.5 1.5 2.0
30 Poland . 0.0 0.0 0.5 0.0 0.5
31 Portugal 0.0 0.0 0.0 0.0 1.0 1.0
32 South Africa 0.0 0.0 0.0 1.0 2.0 3.0
33 Turkey . 0.0 0.0 1.0 1.0 2.0
34 Hungary . . 0.0 0.3 0.0 0.3
35 Iceland . . 0.0 2.0 4.0 6.0
36 Argentina 0.0 0.0 0.0 0.0 0.0 0.0
37 Czech Republic . . 0.0 0.0 1.6 1.6
38 Finland 0.5 . 0.0 0.0 0.0 0.5
39 Ireland . 1.0 0.0 . 1.0 2.0
40 Malaysia . . 0.0 0.0 0.2 0.2
41 Saudi Arabia 0.0 . . . 0.1 0.1
42 Croatia . 0.0 0.0 0.0 0.0 0.0
43 Egypt 0.0 . 0.0 . 0.0 0.0
44 Iran, Islamic Republic of . . . 0.0 0.2 0.2
45 Chile . . 0.0 0.0 0.0 0.0
46 Slovak Republic . . 0.0 . 2.0 2.0
47 Slovenia . . 0.0 0.0 . 0.0
48 Monaco . . 1.0 0.0 . 1.0
49 Morocco . 0.0 0.0 0.0 0.0 0.0
50 New Caledonia . 1.0 0.0 . 1.0 2.0
51 Papua New Guinea 1.0 0.0 . . 0.0 1.0
52 Singapore . . . 0.0 0.5 0.5
53 Tunisia . . . 0.0 0.0 0.0

Number of publications among 10% most cited in field, full counts


Bar chart of publication_year

Share of publications among 10% most cited in field, fractionalized (%)

Obs Country 1990-1994 1995-1999 2000-2004 2005-2009 2010-2014 All years
1 All countries 15.4 13.1 16.9 15.1 15.0 15.1
2 United States 25.0 20.5 26.3 22.9 21.6 23.2
3 Germany 22.7 18.2 15.8 21.8 18.0 19.0
4 France 15.7 17.8 24.0 25.2 20.6 21.2
5 United Kingdom 24.9 24.0 31.7 33.7 28.6 29.0
6 Japan 11.0 7.2 9.0 2.7 5.4 6.8
7 China 0.0 5.7 2.0 3.3 5.7 4.3
8 Russian Federation 0.7 0.0 1.4 1.5 3.5 1.5
9 Canada 9.3 12.3 5.7 9.3 15.3 10.9
10 India 0.8 0.0 0.0 0.0 3.3 0.8
11 Australia 15.2 6.4 30.7 26.4 15.4 19.9
12 Switzerland 20.7 20.1 27.8 31.1 30.7 29.2
13 Italy 50.0 10.9 6.1 0.9 15.0 8.3
14 New Zealand 1.9 15.0 33.2 10.1 27.4 18.8
15 Belgium 27.6 15.5 9.1 26.0 7.1 16.2
16 Israel 36.1 8.3 18.3 13.8 23.6 18.7
17 USSR 0.0 . . . . 0.0
18 Sweden 0.0 1.0 27.3 12.5 7.9 12.9
19 Spain . 16.9 0.0 0.0 14.5 8.6
20 Korea, Republic of 25.0 0.0 9.5 0.0 1.4 2.9
21 Taiwan 5.3 0.0 0.0 0.8 7.6 4.8
22 Netherlands 4.3 6.5 15.8 17.4 38.7 15.3
23 Denmark 0.0 0.0 30.3 1.7 40.5 19.0
24 Bulgaria 0.0 0.0 0.0 0.0 2.4 0.5
25 Mexico 0.0 0.0 0.0 0.0 0.0 0.0
26 Brazil 0.0 0.0 0.0 4.5 4.9 2.8
27 Greece 3.2 22.2 0.0 0.0 0.0 3.3
28 Austria 0.0 0.0 38.0 32.6 22.7 25.2
29 Norway 0.0 0.0 0.0 0.7 18.8 6.4
30 Poland . 0.0 0.0 0.6 0.0 0.2
31 Portugal 0.0 0.0 0.0 0.0 15.8 3.6
32 South Africa 0.0 0.0 0.0 23.9 20.0 13.2
33 Turkey . 0.0 0.0 4.0 16.7 5.0
34 Hungary . . 0.0 7.6 0.0 5.4
35 Iceland . . 0.0 19.2 65.7 38.5
36 Argentina 0.0 0.0 0.0 0.0 0.0 0.0
37 Czech Republic . . 0.0 0.0 21.8 11.8
38 Finland 50.0 . 0.0 0.0 0.0 2.5
39 Ireland . 9.1 0.0 . 25.4 15.1
40 Malaysia . . 0.0 0.0 5.0 3.2
41 Saudi Arabia 0.0 . . . 2.1 1.8
42 Croatia . 0.0 0.0 0.0 0.0 0.0
43 Egypt 0.0 . 0.0 . 0.0 0.0
44 Iran, Islamic Republic of . . . 0.0 1.7 1.4
45 Chile . . 0.0 0.0 0.0 0.0
46 Slovak Republic . . 0.0 . 48.6 18.5
47 Slovenia . . 0.0 0.0 . 0.0
48 Monaco . . 72.2 0.0 . 20.5
49 Morocco . 0.0 0.0 0.0 0.0 0.0
50 New Caledonia . 44.0 0.0 . 100.0 60.8
51 Papua New Guinea 100.0 0.0 . . 0.0 28.4
52 Singapore . . . 0.0 9.4 7.9
53 Tunisia . . . 0.0 0.0 0.0

Share of publications among 10% most cited in field, fractionalized (%)


Bar chart of publication_year

Field normalized citation rate (cf), fractionalized

Obs Country 1990-1994 1995-1999 2000-2004 2005-2009 2010-2014 All years
1 All countries 1.27 1.10 1.28 1.19 1.26 1.22
2 United States 1.79 1.48 1.77 1.62 1.66 1.67
3 Germany 2.02 1.66 1.22 1.50 1.49 1.51
4 France 1.28 1.57 1.81 1.70 1.53 1.59
5 United Kingdom 1.91 1.62 1.97 2.03 1.89 1.89
6 Japan 1.19 0.81 1.14 0.74 0.89 0.94
7 China 0.32 0.39 0.34 0.51 0.80 0.61
8 Russian Federation 0.11 0.14 0.24 0.22 0.32 0.22
9 Canada 1.14 1.05 0.80 1.14 1.43 1.14
10 India 0.37 0.25 0.32 0.36 0.43 0.34
11 Australia 1.12 0.96 1.71 1.45 1.32 1.35
12 Switzerland 1.77 1.39 1.66 1.75 1.87 1.75
13 Italy 2.68 0.91 0.99 0.67 0.98 0.88
14 New Zealand 0.60 1.55 2.56 1.21 1.77 1.56
15 Belgium 2.92 1.03 0.84 1.80 1.39 1.67
16 Israel 2.40 0.99 1.34 1.09 1.51 1.39
17 USSR 0.11 . . . . 0.11
18 Sweden 0.65 1.16 1.91 1.26 1.02 1.30
19 Spain . 2.78 1.19 0.80 1.23 1.20
20 Korea, Republic of 3.16 0.26 0.73 0.65 0.61 0.69
21 Taiwan 0.91 0.92 0.92 0.84 1.03 0.97
22 Netherlands 0.56 0.80 1.27 1.46 2.41 1.23
23 Denmark 0.60 0.20 2.26 1.19 2.08 1.58
24 Bulgaria 0.06 0.10 0.56 0.30 0.41 0.24
25 Mexico 0.61 0.00 0.52 0.59 0.32 0.45
26 Brazil 0.93 0.50 0.29 0.82 0.80 0.64
27 Greece 0.49 1.20 0.62 0.69 0.46 0.62
28 Austria 0.09 0.00 1.97 1.81 1.78 1.58
29 Norway 0.32 1.42 0.65 0.73 1.55 0.97
30 Poland . 0.15 0.29 0.44 0.80 0.53
31 Portugal 0.39 0.74 0.64 0.98 1.43 1.01
32 South Africa 0.63 1.14 1.19 1.44 1.55 1.30
33 Turkey . 0.51 0.35 0.45 0.88 0.53
34 Hungary . . 0.31 0.94 0.55 0.81
35 Iceland . . 1.03 1.63 3.15 2.26
36 Argentina 0.33 0.51 0.85 1.00 0.17 0.51
37 Czech Republic . . 1.06 0.70 1.72 1.30
38 Finland 2.68 . 0.68 0.87 0.61 0.80
39 Ireland . 0.82 0.08 . 2.03 1.25
40 Malaysia . . 1.21 0.87 0.81 0.88
41 Saudi Arabia 0.14 . . . 0.60 0.53
42 Croatia . 0.43 0.45 0.07 0.00 0.16
43 Egypt 0.05 . 0.08 . 0.16 0.11
44 Iran, Islamic Republic of . . . 0.90 0.79 0.81
45 Chile . . 0.51 0.58 0.68 0.60
46 Slovak Republic . . 0.18 . 2.42 1.04
47 Slovenia . . 0.19 0.19 . 0.19
48 Monaco . . 2.00 0.88 . 1.19
49 Morocco . 0.84 0.16 2.32 0.39 0.56
50 New Caledonia . 1.53 0.27 . 4.97 2.79
51 Papua New Guinea 2.39 0.51 . . 0.00 0.90
52 Singapore . . . 0.96 1.12 1.10
53 Tunisia . . . 0.78 0.46 0.50

Field normalized citation rate (cf), fractionalized


Bar chart of publication_year