Lev2: HEAVY METALS//PHYTOREMEDIATION//PHYTOEXTRACTION - Statistics for Countries

Statistics per Country

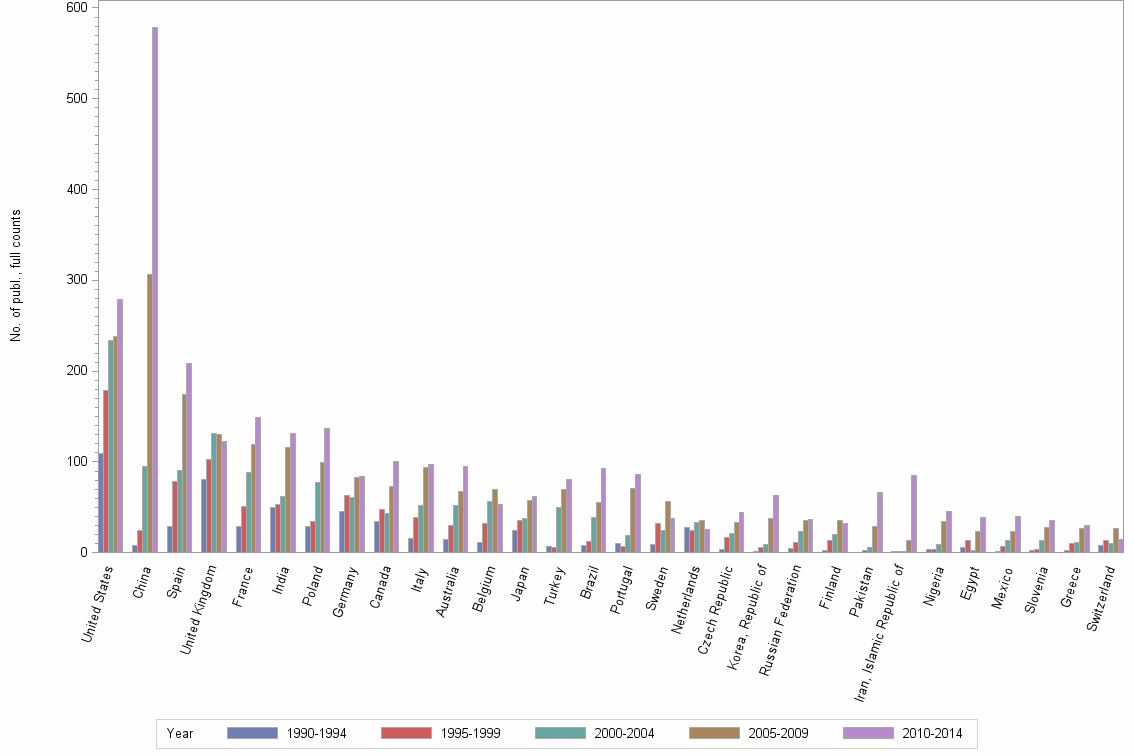
Number of publications, full counts

Obs Country 1990-1994 1995-1999 2000-2004 2005-2009 2010-2014 All years
1 All countries 608 935 1318 2153 2758 7772
2 United States 109 179 234 238 279 1039
3 China 8 24 95 306 578 1011
4 Spain 29 78 91 174 209 581
5 United Kingdom 81 103 131 130 122 567
6 France 29 51 88 119 149 436
7 India 50 53 62 116 131 412
8 Poland 29 34 77 99 137 376
9 Germany 45 63 61 83 84 336
10 Canada 34 48 43 73 100 298
11 Italy 16 39 52 94 97 298
12 Australia 15 30 52 67 95 259
13 Belgium 11 32 56 70 53 222
14 Japan 24 35 38 58 62 217
15 Turkey 7 6 50 70 81 214
16 Brazil 8 12 39 55 93 207
17 Portugal 10 7 19 71 86 193
18 Sweden 9 32 24 56 38 159
19 Netherlands 28 25 33 35 26 147
20 Czech Republic 4 17 21 33 44 119
21 Korea, Republic of 1 6 9 38 63 117
22 Russian Federation 5 11 23 36 37 112
23 Finland 3 13 20 35 32 103
24 Pakistan . 2 6 29 66 103
25 Iran, Islamic Republic of 1 1 1 13 85 101
26 Nigeria 4 4 9 34 45 96
27 Egypt 6 14 3 23 39 85
28 Mexico 1 7 14 23 40 85
29 Slovenia 2 4 13 28 36 83
30 Greece 3 10 11 27 30 81
31 Switzerland 8 14 10 27 15 74
32 Hungary 4 12 15 23 18 72
33 Norway 5 19 17 18 13 72
34 Argentina . 3 12 22 32 69
35 New Zealand 10 8 19 16 13 66
36 Denmark 1 6 14 23 20 64
37 Romania . . 5 18 41 64
38 Taiwan 7 10 11 11 23 62
39 Thailand 1 1 17 25 17 61
40 Republic of Serbia . . . 18 42 60
41 Chile 5 3 2 19 28 57
42 South Africa 4 4 7 12 21 48
43 Austria 3 5 6 17 15 46
44 Ireland . 9 12 12 12 45
45 Malaysia 3 . 4 9 27 43
46 Slovak Republic . 5 6 14 17 42
47 Saudi Arabia 8 8 5 2 16 39
48 Jordan . 1 7 18 12 38
49 Bulgaria 1 4 5 7 16 33
50 Algeria . . 2 8 20 30
51 Israel 1 4 12 5 6 28

Number of publications, full counts


Bar chart of publication_year

Share of the total number of publications in the field, full counts (%)

Obs Country 1990-1994 1995-1999 2000-2004 2005-2009 2010-2014 All years
1 All countries 100.0 100.0 100.0 100.0 100.0 100.0
2 United States 17.9 19.1 17.8 11.1 10.1 13.4
3 China 1.3 2.6 7.2 14.2 21.0 13.0
4 Spain 4.8 8.3 6.9 8.1 7.6 7.5
5 United Kingdom 13.3 11.0 9.9 6.0 4.4 7.3
6 France 4.8 5.5 6.7 5.5 5.4 5.6
7 India 8.2 5.7 4.7 5.4 4.7 5.3
8 Poland 4.8 3.6 5.8 4.6 5.0 4.8
9 Germany 7.4 6.7 4.6 3.9 3.0 4.3
10 Canada 5.6 5.1 3.3 3.4 3.6 3.8
11 Italy 2.6 4.2 3.9 4.4 3.5 3.8
12 Australia 2.5 3.2 3.9 3.1 3.4 3.3
13 Belgium 1.8 3.4 4.2 3.3 1.9 2.9
14 Japan 3.9 3.7 2.9 2.7 2.2 2.8
15 Turkey 1.2 0.6 3.8 3.3 2.9 2.8
16 Brazil 1.3 1.3 3.0 2.6 3.4 2.7
17 Portugal 1.6 0.7 1.4 3.3 3.1 2.5
18 Sweden 1.5 3.4 1.8 2.6 1.4 2.0
19 Netherlands 4.6 2.7 2.5 1.6 0.9 1.9
20 Czech Republic 0.7 1.8 1.6 1.5 1.6 1.5
21 Korea, Republic of 0.2 0.6 0.7 1.8 2.3 1.5
22 Russian Federation 0.8 1.2 1.7 1.7 1.3 1.4
23 Finland 0.5 1.4 1.5 1.6 1.2 1.3
24 Pakistan . 0.2 0.5 1.3 2.4 1.3
25 Iran, Islamic Republic of 0.2 0.1 0.1 0.6 3.1 1.3
26 Nigeria 0.7 0.4 0.7 1.6 1.6 1.2
27 Egypt 1.0 1.5 0.2 1.1 1.4 1.1
28 Mexico 0.2 0.7 1.1 1.1 1.5 1.1
29 Slovenia 0.3 0.4 1.0 1.3 1.3 1.1
30 Greece 0.5 1.1 0.8 1.3 1.1 1.0
31 Switzerland 1.3 1.5 0.8 1.3 0.5 1.0
32 Hungary 0.7 1.3 1.1 1.1 0.7 0.9
33 Norway 0.8 2.0 1.3 0.8 0.5 0.9
34 Argentina . 0.3 0.9 1.0 1.2 0.9
35 New Zealand 1.6 0.9 1.4 0.7 0.5 0.8
36 Denmark 0.2 0.6 1.1 1.1 0.7 0.8
37 Romania . . 0.4 0.8 1.5 0.8
38 Taiwan 1.2 1.1 0.8 0.5 0.8 0.8
39 Thailand 0.2 0.1 1.3 1.2 0.6 0.8
40 Republic of Serbia . . . 0.8 1.5 0.8
41 Chile 0.8 0.3 0.2 0.9 1.0 0.7
42 South Africa 0.7 0.4 0.5 0.6 0.8 0.6
43 Austria 0.5 0.5 0.5 0.8 0.5 0.6
44 Ireland . 1.0 0.9 0.6 0.4 0.6
45 Malaysia 0.5 . 0.3 0.4 1.0 0.6
46 Slovak Republic . 0.5 0.5 0.7 0.6 0.5
47 Saudi Arabia 1.3 0.9 0.4 0.1 0.6 0.5
48 Jordan . 0.1 0.5 0.8 0.4 0.5
49 Bulgaria 0.2 0.4 0.4 0.3 0.6 0.4
50 Algeria . . 0.2 0.4 0.7 0.4
51 Israel 0.2 0.4 0.9 0.2 0.2 0.4

Share of the total number of publications in the field, full counts (%)


Bar chart of publication_year

Number of publications among 10% most cited in field, full counts

Obs Country 1990-1994 1995-1999 2000-2004 2005-2009 2010-2014 All years
1 All countries 98.7 186.7 206.4 251.1 254.2 997.2
2 United States 31.0 46.2 51.0 22.8 21.3 172.3
3 China 1.7 4.3 16.7 56.1 92.9 171.7
4 Spain 7.3 27.0 24.5 28.6 22.3 109.6
5 United Kingdom 20.7 31.4 28.9 20.7 11.7 113.4
6 France 6.0 18.1 26.3 15.5 21.7 87.7
7 India 3.3 9.1 7.7 10.6 9.0 39.8
8 Poland 2.3 6.0 12.3 0.4 7.8 28.8
9 Germany 7.5 12.3 12.0 11.6 10.6 54.0
10 Canada 2.5 7.0 9.5 11.6 14.2 44.9
11 Italy 4.0 11.0 14.0 26.8 9.2 65.0
12 Australia 2.5 4.8 7.5 12.4 9.4 36.6
13 Belgium 8.1 13.8 13.5 12.8 5.3 53.5
14 Japan 3.0 1.2 0.7 5.3 6.1 16.3
15 Turkey 0.5 1.0 4.5 4.0 3.7 13.7
16 Brazil 0.0 2.5 5.3 2.7 2.0 12.5
17 Portugal 0.9 1.8 3.0 9.5 6.6 21.7
18 Sweden 3.7 9.5 5.7 14.0 4.5 37.4
19 Netherlands 4.7 7.5 7.0 6.9 5.5 31.6
20 Czech Republic 0.0 2.0 1.0 4.7 2.0 9.7
21 Korea, Republic of 0.0 0.3 0.0 4.5 11.6 16.3
22 Russian Federation 0.0 0.0 1.0 1.7 0.7 3.3
23 Finland 0.5 2.8 4.0 1.0 0.0 8.3
24 Pakistan . 0.0 1.0 7.1 7.1 15.2
25 Iran, Islamic Republic of 0.0 0.0 0.0 1.3 9.6 10.8
26 Nigeria 0.0 0.0 1.0 1.6 0.0 2.6
27 Egypt 0.0 1.0 1.0 1.0 8.7 11.7
28 Mexico 0.0 0.0 3.3 3.0 0.0 6.4
29 Slovenia 0.0 0.0 0.0 7.1 2.5 9.6
30 Greece 0.0 1.0 2.8 2.0 4.6 10.4
31 Switzerland 3.0 2.0 3.0 2.5 1.7 12.1
32 Hungary 0.0 0.0 1.0 2.0 2.3 5.3
33 Norway 0.0 6.8 6.0 3.0 1.0 16.8
34 Argentina . 0.0 4.5 1.0 2.3 7.8
35 New Zealand 4.8 3.3 4.3 0.0 0.0 12.4
36 Denmark 0.0 0.0 2.0 1.0 4.0 7.0
37 Romania . . 1.0 0.0 0.3 1.3
38 Taiwan 0.0 1.0 1.3 0.1 0.5 3.0
39 Thailand 0.5 1.0 0.3 0.0 0.0 1.8
40 Republic of Serbia . . . 3.6 0.6 4.2
41 Chile 0.0 1.0 0.0 2.0 1.0 4.0
42 South Africa 0.0 0.8 1.3 0.7 0.0 2.7
43 Austria 0.0 3.0 2.3 2.6 0.3 8.2
44 Ireland . 3.0 2.0 1.0 2.9 8.9
45 Malaysia 0.0 . 0.3 0.0 1.3 1.6
46 Slovak Republic . 0.0 0.0 2.0 1.7 3.7
47 Saudi Arabia 0.0 0.0 0.0 0.3 2.4 2.7
48 Jordan . 1.0 1.0 2.5 0.3 4.8
49 Bulgaria 0.0 0.0 0.3 0.0 0.4 0.7
50 Algeria . . 0.0 1.7 2.5 4.2
51 Israel 0.0 0.7 0.5 0.0 0.0 1.2

Number of publications among 10% most cited in field, full counts


Bar chart of publication_year

Share of publications among 10% most cited in field, fractionalized (%)

Obs Country 1990-1994 1995-1999 2000-2004 2005-2009 2010-2014 All years
1 All countries 16.2 20.0 15.7 11.7 9.2 12.8
2 United States 28.8 25.9 21.0 7.6 6.3 16.6
3 China 20.7 16.8 18.0 17.5 16.4 16.9
4 Spain 17.9 31.5 27.5 16.5 10.7 18.5
5 United Kingdom 22.1 27.3 18.5 13.3 8.0 17.7
6 France 21.2 30.6 24.9 11.5 16.0 18.8
7 India 4.6 11.6 9.1 8.3 6.9 7.9
8 Poland 7.2 9.8 11.3 0.2 5.0 5.4
9 Germany 16.9 16.0 13.6 14.6 11.3 14.4
10 Canada 7.0 14.2 18.5 11.9 11.7 12.6
11 Italy 10.4 21.7 22.4 26.1 10.2 18.7
12 Australia 18.8 16.6 14.3 13.7 8.6 12.8
13 Belgium 62.0 39.2 14.6 16.6 8.6 19.9
14 Japan 12.5 3.9 1.8 5.6 6.0 5.6
15 Turkey 7.1 16.7 9.2 5.9 3.5 6.1
16 Brazil 0.0 20.0 8.1 3.6 2.1 4.5
17 Portugal 9.6 21.9 15.0 11.0 6.2 9.4
18 Sweden 37.3 25.5 16.9 23.9 7.0 20.9
19 Netherlands 17.3 24.9 13.9 16.6 16.0 17.7
20 Czech Republic 0.0 9.1 5.1 14.4 5.3 8.2
21 Korea, Republic of 0.0 4.5 0.0 15.4 16.6 14.0
22 Russian Federation 0.0 0.0 1.0 1.9 0.5 1.0
23 Finland 16.7 14.4 12.3 2.9 0.0 5.4
24 Pakistan . 0.0 10.0 26.3 5.5 12.5
25 Iran, Islamic Republic of 0.0 0.0 0.0 10.9 10.7 10.4
26 Nigeria 0.0 0.0 5.9 4.0 0.0 2.1
27 Egypt 0.0 2.6 33.3 5.4 20.6 11.9
28 Mexico 0.0 0.0 13.4 16.0 0.0 5.9
29 Slovenia 0.0 0.0 0.0 23.4 6.6 9.8
30 Greece 0.0 13.2 26.6 5.9 18.9 13.9
31 Switzerland 26.8 15.8 24.2 6.8 12.7 14.5
32 Hungary 0.0 0.0 8.3 8.1 11.3 6.8
33 Norway 0.0 31.6 34.0 16.8 6.5 22.6
34 Argentina . 0.0 40.9 5.4 8.2 12.8
35 New Zealand 43.1 42.7 13.9 0.0 0.0 17.9
36 Denmark 0.0 0.0 17.4 3.7 16.4 10.6
37 Romania . . 9.1 0.0 0.3 0.8
38 Taiwan 0.0 11.5 12.7 1.2 2.7 5.4
39 Thailand 50.0 100.0 0.9 0.0 0.0 1.9
40 Republic of Serbia . . . 21.4 1.6 7.5
41 Chile 0.0 33.3 0.0 16.6 2.9 8.5
42 South Africa 0.0 18.8 13.2 3.3 0.0 4.5
43 Austria 0.0 50.0 21.7 9.5 1.6 11.7
44 Ireland . 33.3 14.9 11.1 19.5 19.4
45 Malaysia 0.0 . 4.2 0.0 5.4 3.8
46 Slovak Republic . 0.0 0.0 16.3 12.0 10.2
47 Saudi Arabia 0.0 0.0 0.0 16.7 11.1 3.6
48 Jordan . 100.0 16.7 12.3 2.9 13.1
49 Bulgaria 0.0 0.0 9.3 0.0 2.7 2.7
50 Algeria . . 0.0 19.4 12.5 13.4
51 Israel 0.0 17.3 1.0 0.0 0.0 3.7

Share of publications among 10% most cited in field, fractionalized (%)


Bar chart of publication_year

Field normalized citation rate (cf), fractionalized

Obs Country 1990-1994 1995-1999 2000-2004 2005-2009 2010-2014 All years
1 All countries 1.54 1.55 1.30 1.09 0.95 1.16
2 United States 2.54 1.93 1.48 0.94 0.85 1.43
3 China 1.17 1.35 1.62 1.41 1.36 1.39
4 Spain 1.69 2.05 1.66 1.44 1.10 1.46
5 United Kingdom 1.95 2.29 1.59 1.34 0.92 1.60
6 France 1.61 2.13 1.44 1.09 1.31 1.40
7 India 0.89 1.11 1.01 0.91 0.78 0.91
8 Poland 0.71 1.20 0.86 0.49 0.55 0.65
9 Germany 1.29 1.18 1.22 1.18 0.96 1.16
10 Canada 1.02 1.12 1.45 1.23 1.16 1.19
11 Italy 2.03 1.17 2.02 1.47 1.15 1.45
12 Australia 1.89 1.34 1.48 1.45 1.06 1.34
13 Belgium 4.76 3.08 1.57 1.32 1.05 1.75
14 Japan 1.44 0.77 0.57 0.84 0.60 0.79
15 Turkey 0.77 1.13 0.86 0.69 0.75 0.77
16 Brazil 0.21 0.83 0.73 0.57 0.44 0.54
17 Portugal 0.84 1.32 1.05 1.10 0.94 1.01
18 Sweden 2.12 2.04 1.60 1.68 1.00 1.64
19 Netherlands 1.58 1.76 1.76 1.26 1.16 1.53
20 Czech Republic 0.42 0.80 0.71 1.27 0.84 0.92
21 Korea, Republic of 0.22 1.28 0.86 1.36 1.28 1.26
22 Russian Federation 0.21 0.08 0.34 0.38 0.33 0.31
23 Finland 1.35 1.12 1.29 0.49 0.44 0.71
24 Pakistan . 0.13 0.57 1.50 0.77 0.99
25 Iran, Islamic Republic of 1.07 0.05 0.10 1.25 0.98 0.99
26 Nigeria 0.36 1.08 0.67 0.43 0.44 0.49
27 Egypt 0.31 0.63 1.44 0.61 1.28 0.90
28 Mexico 0.09 0.56 0.96 1.30 0.44 0.74
29 Slovenia 0.11 0.70 0.60 1.26 0.75 0.85
30 Greece 0.33 1.07 1.71 0.94 1.39 1.19
31 Switzerland 2.20 1.59 1.84 1.17 0.89 1.44
32 Hungary 0.40 0.75 0.63 0.67 0.90 0.71
33 Norway 0.86 1.78 2.61 2.05 1.05 1.82
34 Argentina . 0.56 1.79 0.81 1.02 1.07
35 New Zealand 3.09 1.91 1.47 0.70 1.02 1.58
36 Denmark 0.58 0.82 1.37 1.06 1.20 1.14
37 Romania . . 1.08 0.21 0.37 0.37
38 Taiwan 0.47 1.14 1.11 0.86 0.66 0.83
39 Thailand 2.36 5.64 0.81 0.65 0.51 0.73
40 Republic of Serbia . . . 1.68 0.54 0.88
41 Chile 0.27 1.24 0.24 0.71 0.76 0.69
42 South Africa 1.05 1.71 1.11 0.47 0.46 0.74
43 Austria 0.39 4.14 2.47 1.39 0.95 1.55
44 Ireland . 1.71 1.20 1.23 1.44 1.38
45 Malaysia 1.26 . 1.22 0.88 0.67 0.81
46 Slovak Republic . 0.30 0.26 0.95 0.70 0.67
47 Saudi Arabia 0.29 0.19 0.25 0.96 1.25 0.51
48 Jordan . 3.55 1.35 0.83 0.73 0.98
49 Bulgaria 0.83 0.22 1.24 0.36 0.31 0.46
50 Algeria . . 0.25 1.51 1.03 1.10
51 Israel 1.40 1.63 0.89 0.94 0.95 1.08

Field normalized citation rate (cf), fractionalized


Bar chart of publication_year