Lev2: NEW ZEALAND JOURNAL OF GEOLOGY AND GEOPHYSICS//JOURNAL OF GEOPHYSICAL RESEARCH-SOLID EARTH//BULLETIN OF THE SEISMOLOGICAL SOCIETY OF AMERICA - Statistics for Countries

Statistics per Country

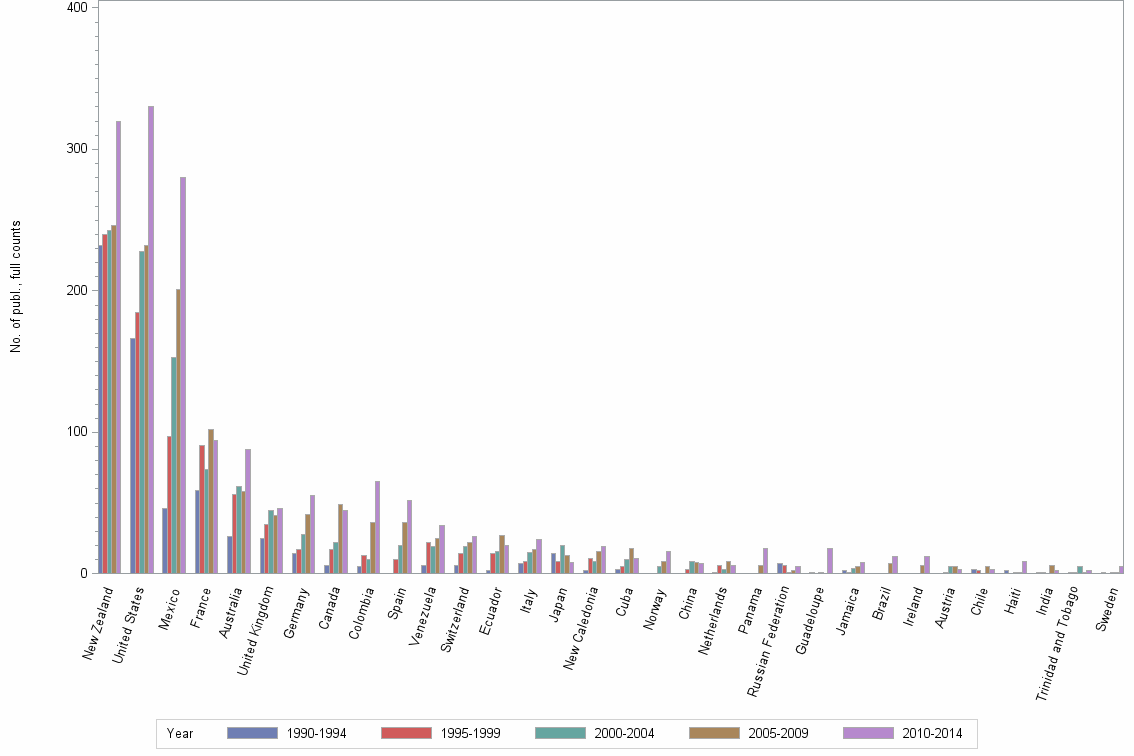
Number of publications, full counts

Obs Country 1990-1994 1995-1999 2000-2004 2005-2009 2010-2014 All years
1 All countries 530 598 667 762 971 3528
2 New Zealand 232 240 243 246 320 1281
3 United States 166 185 228 232 330 1141
4 Mexico 46 97 153 201 280 777
5 France 59 91 74 102 94 420
6 Australia 26 56 62 58 88 290
7 United Kingdom 25 35 45 41 46 192
8 Germany 14 17 28 42 55 156
9 Canada 6 17 22 49 45 139
10 Colombia 5 13 10 36 65 129
11 Spain . 10 20 36 52 118
12 Venezuela 6 22 19 25 34 106
13 Switzerland 6 14 19 22 26 87
14 Ecuador 2 14 16 27 20 79
15 Italy 7 9 15 17 24 72
16 Japan 14 9 20 13 8 64
17 New Caledonia 2 11 9 16 19 57
18 Cuba 3 5 10 18 11 47
19 Norway . . 5 9 16 30
20 China . 3 9 8 7 27
21 Netherlands 1 6 3 9 6 25
22 Panama . . . 6 18 24
23 Russian Federation 7 6 1 2 5 21
24 Guadeloupe 1 . 1 . 18 20
25 Jamaica 2 1 4 5 8 20
26 Brazil . . . 7 12 19
27 Ireland . . . 6 12 18
28 Austria . 1 5 5 3 14
29 Chile 3 2 . 5 3 13
30 Haiti 2 . 1 1 9 13
31 India 1 1 . 6 2 10
32 Trinidad and Tobago 1 1 5 1 2 10
33 Belgium 1 2 . 4 2 9
34 Denmark . 2 2 1 4 9
35 Korea, Republic of . . 1 4 4 9
36 Sweden 1 . 1 1 5 8
37 Taiwan . 2 1 1 3 7
38 Peru 1 1 1 3 . 6
39 South Africa . . 1 . 5 6
40 Argentina 1 1 1 1 1 5
41 Greece . . . . 5 5
42 Martinique 2 . . . 3 5
43 Costa Rica . 1 . . 3 4
44 Dominican Republic . . 2 1 1 4
45 Israel . . . . 4 4
46 Poland 1 1 . 1 1 4
47 Romania . . . . 4 4
48 USSR 4 . . . . 4
49 Guatemala . . 1 2 . 3
50 Hong Kong . 3 . . . 3
51 Philippines . . . 3 . 3
52 Thailand . 1 . 2 . 3

Number of publications, full counts


Bar chart of publication_year

Share of the total number of publications in the field, full counts (%)

Obs Country 1990-1994 1995-1999 2000-2004 2005-2009 2010-2014 All years
1 All countries 100.0 100.0 100.0 100.0 100.0 100.0
2 New Zealand 43.8 40.1 36.4 32.3 33.0 36.3
3 United States 31.3 30.9 34.2 30.4 34.0 32.3
4 Mexico 8.7 16.2 22.9 26.4 28.8 22.0
5 France 11.1 15.2 11.1 13.4 9.7 11.9
6 Australia 4.9 9.4 9.3 7.6 9.1 8.2
7 United Kingdom 4.7 5.9 6.7 5.4 4.7 5.4
8 Germany 2.6 2.8 4.2 5.5 5.7 4.4
9 Canada 1.1 2.8 3.3 6.4 4.6 3.9
10 Colombia 0.9 2.2 1.5 4.7 6.7 3.7
11 Spain . 1.7 3.0 4.7 5.4 3.3
12 Venezuela 1.1 3.7 2.8 3.3 3.5 3.0
13 Switzerland 1.1 2.3 2.8 2.9 2.7 2.5
14 Ecuador 0.4 2.3 2.4 3.5 2.1 2.2
15 Italy 1.3 1.5 2.2 2.2 2.5 2.0
16 Japan 2.6 1.5 3.0 1.7 0.8 1.8
17 New Caledonia 0.4 1.8 1.3 2.1 2.0 1.6
18 Cuba 0.6 0.8 1.5 2.4 1.1 1.3
19 Norway . . 0.7 1.2 1.6 0.9
20 China . 0.5 1.3 1.0 0.7 0.8
21 Netherlands 0.2 1.0 0.4 1.2 0.6 0.7
22 Panama . . . 0.8 1.9 0.7
23 Russian Federation 1.3 1.0 0.1 0.3 0.5 0.6
24 Guadeloupe 0.2 . 0.1 . 1.9 0.6
25 Jamaica 0.4 0.2 0.6 0.7 0.8 0.6
26 Brazil . . . 0.9 1.2 0.5
27 Ireland . . . 0.8 1.2 0.5
28 Austria . 0.2 0.7 0.7 0.3 0.4
29 Chile 0.6 0.3 . 0.7 0.3 0.4
30 Haiti 0.4 . 0.1 0.1 0.9 0.4
31 India 0.2 0.2 . 0.8 0.2 0.3
32 Trinidad and Tobago 0.2 0.2 0.7 0.1 0.2 0.3
33 Belgium 0.2 0.3 . 0.5 0.2 0.3
34 Denmark . 0.3 0.3 0.1 0.4 0.3
35 Korea, Republic of . . 0.1 0.5 0.4 0.3
36 Sweden 0.2 . 0.1 0.1 0.5 0.2
37 Taiwan . 0.3 0.1 0.1 0.3 0.2
38 Peru 0.2 0.2 0.1 0.4 . 0.2
39 South Africa . . 0.1 . 0.5 0.2
40 Argentina 0.2 0.2 0.1 0.1 0.1 0.1
41 Greece . . . . 0.5 0.1
42 Martinique 0.4 . . . 0.3 0.1
43 Costa Rica . 0.2 . . 0.3 0.1
44 Dominican Republic . . 0.3 0.1 0.1 0.1
45 Israel . . . . 0.4 0.1
46 Poland 0.2 0.2 . 0.1 0.1 0.1
47 Romania . . . . 0.4 0.1
48 USSR 0.8 . . . . 0.1
49 Guatemala . . 0.1 0.3 . 0.1
50 Hong Kong . 0.5 . . . 0.1
51 Philippines . . . 0.4 . 0.1
52 Thailand . 0.2 . 0.3 . 0.1

Share of the total number of publications in the field, full counts (%)


Bar chart of publication_year

Number of publications among 10% most cited in field, full counts

Obs Country 1990-1994 1995-1999 2000-2004 2005-2009 2010-2014 All years
1 All countries 46.7 64.1 35.0 38.8 60.0 244.7
2 New Zealand 19.0 29.3 11.0 11.4 38.3 109.0
3 United States 18.0 25.7 16.8 17.1 19.7 97.3
4 Mexico 6.0 8.0 8.4 10.8 9.8 43.0
5 France 4.3 5.7 6.0 5.0 3.7 24.7
6 Australia 2.5 11.6 2.0 2.0 3.4 21.5
7 United Kingdom 1.0 10.8 2.0 7.7 5.0 26.6
8 Germany 0.0 1.1 0.0 3.4 7.0 11.6
9 Canada 1.0 2.3 1.3 1.5 0.0 6.2
10 Colombia 0.9 3.7 1.0 2.3 3.0 10.9
11 Spain . 1.0 0.0 2.4 1.8 5.2
12 Venezuela 0.0 0.3 2.0 0.0 0.0 2.3
13 Switzerland 0.9 1.5 2.5 1.0 1.2 7.1
14 Ecuador 0.0 0.0 3.5 0.0 0.2 3.7
15 Italy 0.0 0.0 0.0 1.0 1.0 2.0
16 Japan 3.0 1.0 1.0 2.0 2.0 9.0
17 New Caledonia 1.0 1.5 0.0 0.0 0.5 3.0
18 Cuba 1.0 1.2 0.0 2.9 0.0 5.1
19 Norway . . 0.0 0.0 1.1 1.1
20 China . 0.0 0.0 1.0 1.0 2.0
21 Netherlands 0.0 1.5 2.0 1.0 0.1 4.6
22 Panama . . . 0.0 1.0 1.0
23 Russian Federation 0.0 0.0 0.0 0.0 0.0 0.0
24 Guadeloupe 0.0 . 0.0 . 0.0 0.0
25 Jamaica 0.0 0.0 0.0 0.0 0.0 0.0
26 Brazil . . . 0.0 0.0 0.0
27 Ireland . . . 0.0 0.0 0.0
28 Austria . 0.0 1.0 0.4 0.0 1.4
29 Chile 2.0 0.0 . 0.5 0.0 2.5
30 Haiti 0.0 . 0.0 1.0 3.0 4.0
31 India 0.0 0.0 . 1.0 1.0 2.0
32 Trinidad and Tobago 0.0 0.0 1.0 0.0 0.0 1.0
33 Belgium 0.0 0.0 . 0.0 0.0 0.0
34 Denmark . 1.0 0.0 0.0 1.0 2.0
35 Korea, Republic of . . 0.0 0.0 0.0 0.0
36 Sweden 0.0 . 0.0 1.0 0.9 1.9
37 Taiwan . 0.0 0.0 0.0 0.0 0.0
38 Peru 1.0 0.0 1.0 0.0 . 2.0
39 South Africa . . 0.0 . 0.1 0.1
40 Argentina 0.0 0.0 0.0 0.0 0.0 0.0
41 Greece . . . . 0.0 0.0
42 Martinique 0.0 . . . 0.0 0.0
43 Costa Rica . 0.0 . . 0.0 0.0
44 Dominican Republic . . 0.0 0.0 0.0 0.0
45 Israel . . . . 0.0 0.0
46 Poland 0.0 0.0 . 0.0 0.0 0.0
47 Romania . . . . 0.0 0.0
48 USSR 0.0 . . . . 0.0
49 Guatemala . . 0.0 0.0 . 0.0
50 Hong Kong . 0.0 . . . 0.0
51 Philippines . . . 1.0 . 1.0
52 Thailand . 0.0 . 1.0 . 1.0

Number of publications among 10% most cited in field, full counts


Bar chart of publication_year

Share of publications among 10% most cited in field, fractionalized (%)

Obs Country 1990-1994 1995-1999 2000-2004 2005-2009 2010-2014 All years
1 All countries 8.8 10.7 5.3 5.1 6.2 6.9
2 New Zealand 8.1 11.2 4.7 3.0 12.3 8.1
3 United States 10.6 11.4 7.3 7.9 4.8 8.1
4 Mexico 11.8 8.7 5.2 3.5 3.6 5.0
5 France 4.8 3.8 6.2 4.7 4.9 4.8
6 Australia 11.0 22.2 3.6 4.3 2.7 8.0
7 United Kingdom 1.6 25.7 5.2 17.0 10.8 12.2
8 Germany 0.0 4.9 0.0 7.2 9.1 4.8
9 Canada 15.4 12.7 6.5 2.2 0.0 4.3
10 Colombia 14.9 19.6 6.7 3.7 4.2 6.3
11 Spain . 11.5 0.0 5.7 1.9 3.7
12 Venezuela 0.0 0.6 4.7 0.0 0.0 1.0
13 Switzerland 26.6 9.4 13.4 5.4 6.2 8.8
14 Ecuador 0.0 0.0 13.9 0.0 0.5 2.8
15 Italy 0.0 0.0 0.0 5.4 1.3 1.6
16 Japan 31.0 13.4 1.8 16.2 7.4 13.7
17 New Caledonia 72.7 14.1 0.0 0.0 1.1 5.0
18 Cuba 42.9 25.3 0.0 18.0 0.0 14.5
19 Norway . . 0.0 0.0 3.7 1.8
20 China . 0.0 0.0 7.5 3.3 2.2
21 Netherlands 0.0 26.2 48.1 22.0 0.2 13.9
22 Panama . . . 0.0 8.0 5.4
23 Russian Federation 0.0 0.0 0.0 0.0 0.0 0.0
24 Guadeloupe 0.0 . 0.0 . 0.0 0.0
25 Jamaica 0.0 0.0 0.0 0.0 0.0 0.0
26 Brazil . . . 0.0 0.0 0.0
27 Ireland . . . 0.0 0.0 0.0
28 Austria . 0.0 32.6 6.2 0.0 13.8
29 Chile 66.7 0.0 . 11.5 0.0 22.8
30 Haiti 0.0 . 0.0 100.0 27.8 25.5
31 India 0.0 0.0 . 10.6 40.0 11.1
32 Trinidad and Tobago 0.0 0.0 8.1 0.0 0.0 3.7
33 Belgium 0.0 0.0 . 0.0 0.0 0.0
34 Denmark . 40.0 0.0 0.0 22.7 19.5
35 Korea, Republic of . . 0.0 0.0 0.0 0.0
36 Sweden 0.0 . 0.0 100.0 23.0 17.5
37 Taiwan . 0.0 0.0 0.0 0.0 0.0
38 Peru 100.0 0.0 100.0 0.0 . 35.4
39 South Africa . . 0.0 . 0.5 0.4
40 Argentina 0.0 0.0 0.0 0.0 0.0 0.0
41 Greece . . . . 0.0 0.0
42 Martinique 0.0 . . . 0.0 0.0
43 Costa Rica . 0.0 . . 0.0 0.0
44 Dominican Republic . . 0.0 0.0 0.0 0.0
45 Israel . . . . 0.0 0.0
46 Poland 0.0 0.0 . 0.0 0.0 0.0
47 Romania . . . . 0.0 0.0
48 USSR 0.0 . . . . 0.0
49 Guatemala . . 0.0 0.0 . 0.0
50 Hong Kong . 0.0 . . . 0.0
51 Philippines . . . 21.4 . 21.4
52 Thailand . 0.0 . 57.1 . 30.8

Share of publications among 10% most cited in field, fractionalized (%)


Bar chart of publication_year

Field normalized citation rate (cf), fractionalized

Obs Country 1990-1994 1995-1999 2000-2004 2005-2009 2010-2014 All years
1 All countries 1.08 1.06 0.84 0.81 0.82 0.90
2 New Zealand 0.91 1.00 0.80 0.74 1.23 0.95
3 United States 1.73 1.12 0.94 1.08 0.83 1.12
4 Mexico 0.83 0.99 0.87 0.65 0.53 0.70
5 France 0.63 0.74 1.10 0.68 0.70 0.77
6 Australia 1.04 1.45 0.95 0.91 0.75 1.00
7 United Kingdom 0.74 1.76 0.73 1.38 1.19 1.16
8 Germany 0.82 0.96 0.75 0.94 0.86 0.87
9 Canada 2.81 2.63 1.06 0.83 0.48 1.11
10 Colombia 0.41 3.10 0.53 0.62 0.60 0.85
11 Spain . 0.62 0.49 0.75 0.46 0.57
12 Venezuela 0.45 0.36 0.69 0.43 0.32 0.43
13 Switzerland 0.52 0.81 0.99 0.85 0.90 0.88
14 Ecuador 0.86 0.67 1.42 0.59 0.46 0.75
15 Italy 0.41 0.96 0.77 0.68 0.76 0.71
16 Japan 1.25 1.07 0.50 1.16 1.26 0.98
17 New Caledonia 0.91 0.92 0.45 0.67 0.81 0.73
18 Cuba 2.07 1.59 0.30 1.06 0.49 0.96
19 Norway . . 0.39 0.53 0.76 0.61
20 China . 1.18 0.18 0.81 0.28 0.42
21 Netherlands 1.20 1.43 2.02 1.23 1.29 1.33
22 Panama . . . 0.64 0.86 0.79
23 Russian Federation 0.18 0.04 0.00 0.07 0.11 0.10
24 Guadeloupe 0.54 . 0.99 . 0.66 0.67
25 Jamaica 0.03 0.16 0.29 0.65 0.72 0.56
26 Brazil . . . 0.68 0.37 0.48
27 Ireland . . . 1.16 0.99 1.06
28 Austria . 0.10 1.21 0.98 0.53 0.87
29 Chile 1.92 0.25 . 1.17 0.13 0.97
30 Haiti 0.11 . 0.80 3.87 1.41 1.29
31 India 0.18 1.06 . 1.15 2.50 1.16
32 Trinidad and Tobago 1.03 0.00 0.40 0.81 0.33 0.37
33 Belgium 0.93 0.57 . 0.40 0.98 0.63
34 Denmark . 2.55 0.56 0.34 1.17 1.23
35 Korea, Republic of . . 0.19 0.22 0.41 0.28
36 Sweden 0.80 . 0.10 2.61 1.27 0.95
37 Taiwan . 0.19 0.58 0.95 0.91 0.50
38 Peru 2.95 0.23 3.04 0.54 . 1.37
39 South Africa . . 0.39 . 0.70 0.65
40 Argentina 0.56 0.91 0.19 0.72 0.00 0.38
41 Greece . . . . 0.31 0.31
42 Martinique 0.45 . . . 0.38 0.42
43 Costa Rica . 1.57 . . 0.80 1.06
44 Dominican Republic . . 0.12 0.43 0.18 0.23
45 Israel . . . . 0.42 0.42
46 Poland 0.03 0.22 . 0.49 0.99 0.47
47 Romania . . . . 0.57 0.57
48 USSR 0.00 . . . . 0.00
49 Guatemala . . 1.08 1.01 . 1.04
50 Hong Kong . 1.06 . . . 1.06
51 Philippines . . . 0.83 . 0.83
52 Thailand . 0.12 . 1.76 . 1.00

Field normalized citation rate (cf), fractionalized


Bar chart of publication_year