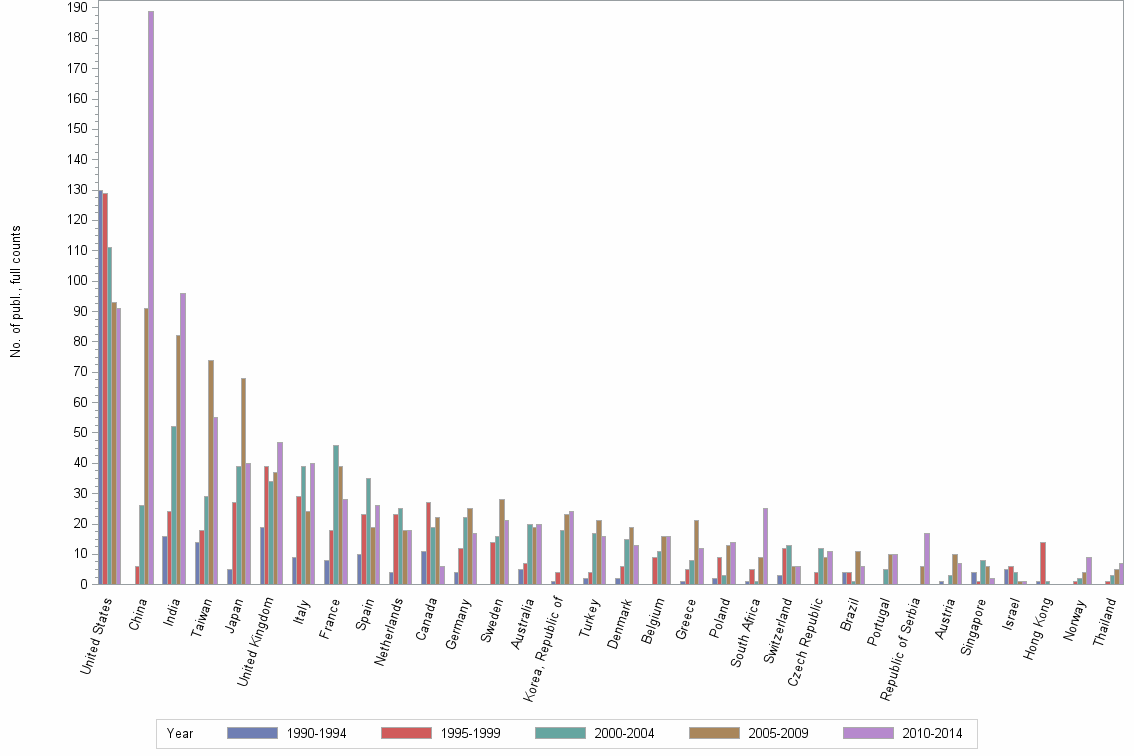
Lev2: FLY ASH//INTERNATIONAL JOURNAL OF COAL GEOLOGY//COAL FLY ASH - Statistics for Countries

Statistics per Country

Number of publications, full counts

Obs Country 1990-1994 1995-1999 2000-2004 2005-2009 2010-2014 All years
1 All countries 262 461 569 763 808 2863
2 United States 130 129 111 93 91 554
3 China . 6 26 91 189 312
4 India 16 24 52 82 96 270
5 Taiwan 14 18 29 74 55 190
6 Japan 5 27 39 68 40 179
7 United Kingdom 19 39 34 37 47 176
8 Italy 9 29 39 24 40 141
9 France 8 18 46 39 28 139
10 Spain 10 23 35 19 26 113
11 Netherlands 4 23 25 18 18 88
12 Canada 11 27 19 22 6 85
13 Germany 4 12 22 25 17 80
14 Sweden . 14 16 28 21 79
15 Australia 5 7 20 19 20 71
16 Korea, Republic of 1 4 18 23 24 70
17 Turkey 2 4 17 21 16 60
18 Denmark 2 6 15 19 13 55
19 Belgium . 9 11 16 16 52
20 Greece 1 5 8 21 12 47
21 Poland 2 9 3 13 14 41
22 South Africa 1 5 1 9 25 41
23 Switzerland 3 12 13 6 6 40
24 Czech Republic . 4 12 9 11 36
25 Brazil 4 4 1 11 6 26
26 Portugal . . 5 10 10 25
27 Republic of Serbia . . . 6 17 23
28 Austria 1 . 3 10 7 21
29 Singapore 4 1 8 6 2 21
30 Israel 5 6 4 1 1 17
31 Hong Kong 1 14 1 . . 16
32 Norway . 1 2 4 9 16
33 Thailand . 1 3 5 7 16
34 Egypt 1 1 1 1 11 15
35 Finland 2 2 1 5 5 15
36 Iran, Islamic Republic of . . . 7 7 14
37 Malaysia . 1 3 3 5 12
38 Romania . . . 5 6 11
39 Hungary 3 3 2 2 . 10
40 Croatia . . 1 3 5 9
41 New Zealand . 2 1 2 4 9
42 Slovak Republic . 4 2 . 2 8
43 Slovenia . . . 4 4 8
44 Pakistan . . . 2 3 5
45 Republic of Montenegro . . . 2 3 5
46 Algeria . . 1 . 3 4
47 Argentina . . 2 1 1 4
48 Bulgaria . 1 1 1 1 4
49 Nigeria . 1 . 1 2 4
50 Oman . . . 3 1 4
51 Russian Federation . 1 . 2 1 4

Number of publications, full counts


Bar chart of publication_year

Share of the total number of publications in the field, full counts (%)

Obs Country 1990-1994 1995-1999 2000-2004 2005-2009 2010-2014 All years
1 All countries 100.0 100.0 100.0 100.0 100.0 100.0
2 United States 49.6 28.0 19.5 12.2 11.3 19.4
3 China . 1.3 4.6 11.9 23.4 10.9
4 India 6.1 5.2 9.1 10.7 11.9 9.4
5 Taiwan 5.3 3.9 5.1 9.7 6.8 6.6
6 Japan 1.9 5.9 6.9 8.9 5.0 6.3
7 United Kingdom 7.3 8.5 6.0 4.8 5.8 6.1
8 Italy 3.4 6.3 6.9 3.1 5.0 4.9
9 France 3.1 3.9 8.1 5.1 3.5 4.9
10 Spain 3.8 5.0 6.2 2.5 3.2 3.9
11 Netherlands 1.5 5.0 4.4 2.4 2.2 3.1
12 Canada 4.2 5.9 3.3 2.9 0.7 3.0
13 Germany 1.5 2.6 3.9 3.3 2.1 2.8
14 Sweden . 3.0 2.8 3.7 2.6 2.8
15 Australia 1.9 1.5 3.5 2.5 2.5 2.5
16 Korea, Republic of 0.4 0.9 3.2 3.0 3.0 2.4
17 Turkey 0.8 0.9 3.0 2.8 2.0 2.1
18 Denmark 0.8 1.3 2.6 2.5 1.6 1.9
19 Belgium . 2.0 1.9 2.1 2.0 1.8
20 Greece 0.4 1.1 1.4 2.8 1.5 1.6
21 Poland 0.8 2.0 0.5 1.7 1.7 1.4
22 South Africa 0.4 1.1 0.2 1.2 3.1 1.4
23 Switzerland 1.1 2.6 2.3 0.8 0.7 1.4
24 Czech Republic . 0.9 2.1 1.2 1.4 1.3
25 Brazil 1.5 0.9 0.2 1.4 0.7 0.9
26 Portugal . . 0.9 1.3 1.2 0.9
27 Republic of Serbia . . . 0.8 2.1 0.8
28 Austria 0.4 . 0.5 1.3 0.9 0.7
29 Singapore 1.5 0.2 1.4 0.8 0.2 0.7
30 Israel 1.9 1.3 0.7 0.1 0.1 0.6
31 Hong Kong 0.4 3.0 0.2 . . 0.6
32 Norway . 0.2 0.4 0.5 1.1 0.6
33 Thailand . 0.2 0.5 0.7 0.9 0.6
34 Egypt 0.4 0.2 0.2 0.1 1.4 0.5
35 Finland 0.8 0.4 0.2 0.7 0.6 0.5
36 Iran, Islamic Republic of . . . 0.9 0.9 0.5
37 Malaysia . 0.2 0.5 0.4 0.6 0.4
38 Romania . . . 0.7 0.7 0.4
39 Hungary 1.1 0.7 0.4 0.3 . 0.3
40 Croatia . . 0.2 0.4 0.6 0.3
41 New Zealand . 0.4 0.2 0.3 0.5 0.3
42 Slovak Republic . 0.9 0.4 . 0.2 0.3
43 Slovenia . . . 0.5 0.5 0.3
44 Pakistan . . . 0.3 0.4 0.2
45 Republic of Montenegro . . . 0.3 0.4 0.2
46 Algeria . . 0.2 . 0.4 0.1
47 Argentina . . 0.4 0.1 0.1 0.1
48 Bulgaria . 0.2 0.2 0.1 0.1 0.1
49 Nigeria . 0.2 . 0.1 0.2 0.1
50 Oman . . . 0.4 0.1 0.1
51 Russian Federation . 0.2 . 0.3 0.1 0.1

Share of the total number of publications in the field, full counts (%)


Bar chart of publication_year

Number of publications among 10% most cited in field, full counts

Obs Country 1990-1994 1995-1999 2000-2004 2005-2009 2010-2014 All years
1 All countries 21.1 42.1 46.7 31.9 33.4 175.1
2 United States 14.4 10.6 9.8 4.0 5.3 44.1
3 China . 0.8 2.0 3.8 12.4 19.1
4 India 0.3 2.3 3.0 4.5 3.7 13.9
5 Taiwan 0.0 0.7 1.0 2.7 0.0 4.3
6 Japan 0.0 3.0 4.3 1.6 0.5 9.5
7 United Kingdom 2.0 5.2 2.8 0.5 3.6 14.1
8 Italy 0.7 0.7 4.7 0.0 2.0 8.0
9 France 1.0 1.3 3.5 0.3 0.1 6.2
10 Spain 2.0 2.2 5.0 0.7 1.7 11.5
11 Netherlands 0.0 7.5 5.0 1.0 2.7 16.2
12 Canada 0.0 3.0 3.3 0.0 1.0 7.3
13 Germany 0.0 1.5 2.0 2.0 0.8 6.3
14 Sweden . 2.0 1.5 0.0 0.7 4.2
15 Australia 0.0 0.0 2.8 1.8 1.3 6.0
16 Korea, Republic of 0.0 0.0 3.3 1.0 0.0 4.3
17 Turkey 0.0 1.0 1.3 0.0 0.2 2.5
18 Denmark 0.0 3.0 3.0 1.0 1.4 8.4
19 Belgium . 1.3 0.2 2.7 0.0 4.2
20 Greece 0.0 0.0 1.0 2.7 1.3 5.0
21 Poland 0.0 0.0 0.0 0.0 0.0 0.0
22 South Africa 0.0 0.0 0.0 1.0 1.0 2.0
23 Switzerland 1.0 3.5 1.0 1.0 1.0 7.5
24 Czech Republic . 0.0 0.0 0.0 0.6 0.6
25 Brazil 0.0 0.0 0.0 0.0 0.0 0.0
26 Portugal . . 1.0 0.4 0.2 1.6
27 Republic of Serbia . . . 0.0 0.0 0.0
28 Austria 0.0 . 1.0 0.0 2.5 3.5
29 Singapore 0.3 0.0 0.0 1.0 0.0 1.3
30 Israel 0.0 2.0 0.0 0.0 0.0 2.0
31 Hong Kong 0.3 0.3 0.0 . . 0.7
32 Norway . 0.0 0.8 0.5 1.0 2.3
33 Thailand . 0.0 0.0 0.0 0.0 0.0
34 Egypt 0.0 0.0 0.0 0.0 0.0 0.0
35 Finland 0.0 0.0 0.0 0.5 0.0 0.5
36 Iran, Islamic Republic of . . . 0.0 0.0 0.0
37 Malaysia . 0.0 0.0 0.0 0.0 0.0
38 Romania . . . 0.0 0.0 0.0
39 Hungary 0.0 0.0 0.0 0.0 . 0.0
40 Croatia . . 0.0 0.0 0.0 0.0
41 New Zealand . 0.0 0.0 0.0 0.0 0.0
42 Slovak Republic . 0.0 0.0 . 0.0 0.0
43 Slovenia . . . 0.0 0.0 0.0
44 Pakistan . . . 0.0 0.0 0.0
45 Republic of Montenegro . . . 0.0 0.0 0.0
46 Algeria . . 0.0 . 0.0 0.0
47 Argentina . . 0.0 0.0 0.0 0.0
48 Bulgaria . 0.0 0.0 0.0 0.0 0.0
49 Nigeria . 0.0 . 0.0 0.0 0.0
50 Oman . . . 0.0 0.0 0.0
51 Russian Federation . 0.0 . 0.0 0.0 0.0

Number of publications among 10% most cited in field, full counts


Bar chart of publication_year

Share of publications among 10% most cited in field, fractionalized (%)

Obs Country 1990-1994 1995-1999 2000-2004 2005-2009 2010-2014 All years
1 All countries 8.0 9.1 8.2 4.2 4.1 6.1
2 United States 11.0 7.7 6.6 5.0 3.4 7.4
3 China . 14.8 7.7 4.0 6.1 5.8
4 India 2.2 10.1 5.1 5.5 3.3 4.9
5 Taiwan 0.0 3.8 3.6 3.8 0.0 2.4
6 Japan 0.0 8.3 11.6 2.4 1.4 5.0
7 United Kingdom 8.6 13.1 8.6 2.0 4.0 7.5
8 Italy 7.6 2.3 11.0 0.0 6.2 5.6
9 France 15.4 7.5 8.3 1.0 0.4 5.0
10 Spain 15.8 7.6 13.7 3.7 5.9 9.4
11 Netherlands 0.0 29.4 16.8 6.9 12.5 16.5
12 Canada 0.0 8.7 14.4 0.0 26.0 7.3
13 Germany 0.0 4.0 3.6 9.5 6.2 6.0
14 Sweden . 9.7 6.1 0.0 3.6 3.9
15 Australia 0.0 0.0 13.9 12.2 4.3 8.6
16 Korea, Republic of 0.0 0.0 18.4 5.2 0.0 6.8
17 Turkey 0.0 25.0 6.3 0.0 1.5 4.0
18 Denmark 0.0 77.5 7.8 6.1 15.0 11.8
19 Belgium . 16.3 2.1 15.1 0.0 8.4
20 Greece 0.0 0.0 5.0 11.6 11.8 9.1
21 Poland 0.0 0.0 0.0 0.0 0.0 0.0
22 South Africa 0.0 0.0 0.0 13.6 4.5 5.6
23 Switzerland 33.3 32.3 8.3 13.0 28.7 20.9
24 Czech Republic . 0.0 0.0 0.0 3.6 1.0
25 Brazil 0.0 0.0 0.0 0.0 0.0 0.0
26 Portugal . . 18.2 5.3 1.8 6.1
27 Republic of Serbia . . . 0.0 0.0 0.0
28 Austria 0.0 . 8.6 0.0 40.9 19.7
29 Singapore 11.1 0.0 0.0 14.3 0.0 5.6
30 Israel 0.0 33.3 0.0 0.0 0.0 14.0
31 Hong Kong 33.3 1.3 0.0 . . 3.4
32 Norway . 0.0 41.7 12.5 13.6 17.2
33 Thailand . 0.0 0.0 0.0 0.0 0.0
34 Egypt 0.0 0.0 0.0 0.0 0.0 0.0
35 Finland 0.0 0.0 0.0 7.4 0.0 2.6
36 Iran, Islamic Republic of . . . 0.0 0.0 0.0
37 Malaysia . 0.0 0.0 0.0 0.0 0.0
38 Romania . . . 0.0 0.0 0.0
39 Hungary 0.0 0.0 0.0 0.0 . 0.0
40 Croatia . . 0.0 0.0 0.0 0.0
41 New Zealand . 0.0 0.0 0.0 0.0 0.0
42 Slovak Republic . 0.0 0.0 . 0.0 0.0
43 Slovenia . . . 0.0 0.0 0.0
44 Pakistan . . . 0.0 0.0 0.0
45 Republic of Montenegro . . . 0.0 0.0 0.0
46 Algeria . . 0.0 . 0.0 0.0
47 Argentina . . 0.0 0.0 0.0 0.0
48 Bulgaria . 0.0 0.0 0.0 0.0 0.0
49 Nigeria . 0.0 . 0.0 0.0 0.0
50 Oman . . . 0.0 0.0 0.0
51 Russian Federation . 0.0 . 0.0 0.0 0.0

Share of publications among 10% most cited in field, fractionalized (%)


Bar chart of publication_year

Field normalized citation rate (cf), fractionalized

Obs Country 1990-1994 1995-1999 2000-2004 2005-2009 2010-2014 All years
1 All countries 0.87 0.97 0.92 0.72 0.64 0.79
2 United States 1.11 0.97 0.81 0.77 0.53 0.88
3 China . 1.09 1.12 0.73 0.67 0.73
4 India 0.48 0.79 0.69 0.85 0.66 0.72
5 Taiwan 0.32 0.74 1.04 0.69 0.45 0.65
6 Japan 0.16 0.83 1.10 0.53 0.41 0.66
7 United Kingdom 0.92 1.09 0.88 0.71 0.71 0.87
8 Italy 0.60 0.51 0.91 0.51 0.96 0.74
9 France 1.03 1.30 0.89 0.55 0.72 0.82
10 Spain 0.83 0.78 1.13 0.56 1.03 0.91
11 Netherlands 1.09 1.79 1.55 1.27 0.93 1.43
12 Canada 0.67 0.90 1.11 0.49 1.57 0.84
13 Germany 0.40 0.99 0.70 1.05 0.99 0.89
14 Sweden . 1.11 0.92 0.62 0.59 0.75
15 Australia 0.35 0.49 1.04 1.12 0.64 0.86
16 Korea, Republic of 0.38 0.30 1.24 0.64 0.34 0.68
17 Turkey 0.09 1.62 0.86 0.39 0.62 0.67
18 Denmark 1.02 5.20 0.84 1.00 1.09 1.18
19 Belgium . 1.86 1.10 1.37 0.84 1.26
20 Greece 0.34 1.23 0.81 1.04 1.25 1.07
21 Poland 0.46 0.53 0.44 0.32 0.42 0.41
22 South Africa 0.25 0.40 0.30 1.70 0.67 0.83
23 Switzerland 1.59 2.16 1.25 0.90 1.55 1.56
24 Czech Republic . 0.04 0.24 0.54 0.73 0.43
25 Brazil 0.21 0.43 0.47 0.46 0.55 0.45
26 Portugal . . 1.82 1.18 1.02 1.23
27 Republic of Serbia . . . 0.35 0.34 0.34
28 Austria 1.60 . 0.67 0.69 1.97 1.31
29 Singapore 1.03 0.98 0.46 1.00 0.10 0.70
30 Israel 0.40 1.59 0.34 0.37 0.00 0.86
31 Hong Kong 2.16 1.02 0.80 . . 1.09
32 Norway . 0.25 1.63 0.92 1.01 1.07
33 Thailand . 0.05 1.49 0.78 0.27 0.64
34 Egypt 0.09 0.25 0.10 0.44 0.30 0.27
35 Finland 0.09 0.97 0.76 0.62 0.36 0.50
36 Iran, Islamic Republic of . . . 0.20 0.16 0.18
37 Malaysia . 0.04 0.94 0.74 0.23 0.51
38 Romania . . . 0.18 0.01 0.09
39 Hungary 0.40 0.37 0.47 0.38 . 0.40
40 Croatia . . 0.10 0.40 0.15 0.20
41 New Zealand . 0.91 1.56 0.37 0.49 0.68
42 Slovak Republic . 0.22 0.18 . 0.15 0.19
43 Slovenia . . . 0.37 0.82 0.59
44 Pakistan . . . 0.17 0.12 0.14
45 Republic of Montenegro . . . 0.10 0.06 0.07
46 Algeria . . 0.10 . 0.00 0.02
47 Argentina . . 0.77 0.37 1.24 0.72
48 Bulgaria . 0.29 0.11 0.05 0.50 0.23
49 Nigeria . 0.22 . 0.09 0.19 0.17
50 Oman . . . 0.68 0.00 0.51
51 Russian Federation . 0.76 . 0.40 0.08 0.30

Field normalized citation rate (cf), fractionalized


Bar chart of publication_year