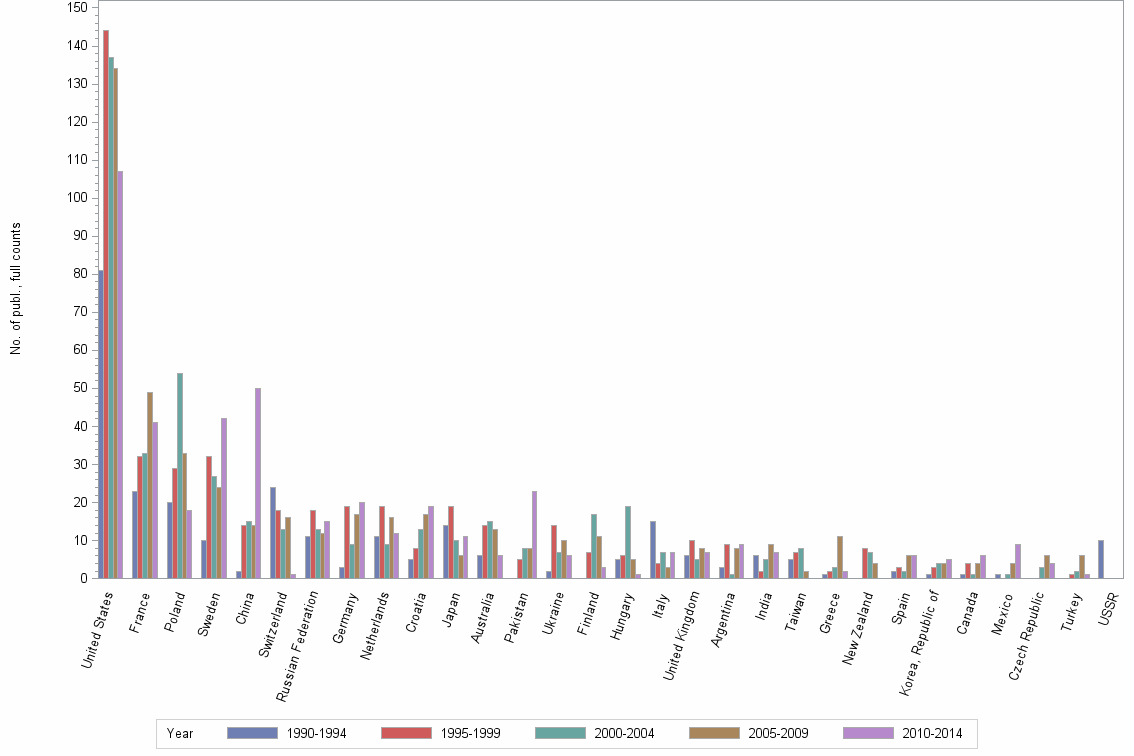
Lev2: ANALYT POLYMER//SURFACE COMPLEXATION//NOVEL THIN FILM SOLAR CELLS - Statistics for Countries

Statistics per Country

Number of publications, full counts

Obs Country 1990-1994 1995-1999 2000-2004 2005-2009 2010-2014 All years
1 All countries 254 405 396 390 352 1797
2 United States 81 144 137 134 107 603
3 France 23 32 33 49 41 178
4 Poland 20 29 54 33 18 154
5 Sweden 10 32 27 24 42 135
6 China 2 14 15 14 50 95
7 Switzerland 24 18 13 16 1 72
8 Russian Federation 11 18 13 12 15 69
9 Germany 3 19 9 17 20 68
10 Netherlands 11 19 9 16 12 67
11 Croatia 5 8 13 17 19 62
12 Japan 14 19 10 6 11 60
13 Australia 6 14 15 13 6 54
14 Pakistan . 5 8 8 23 44
15 Ukraine 2 14 7 10 6 39
16 Finland . 7 17 11 3 38
17 Hungary 5 6 19 5 1 36
18 Italy 15 4 7 3 7 36
19 United Kingdom 6 10 5 8 7 36
20 Argentina 3 9 1 8 9 30
21 India 6 2 5 9 7 29
22 Taiwan 5 7 8 2 . 22
23 Greece 1 2 3 11 2 19
24 New Zealand . 8 7 4 . 19
25 Spain 2 3 2 6 6 19
26 Korea, Republic of 1 3 4 4 5 17
27 Canada 1 4 1 4 6 16
28 Mexico 1 . 1 4 9 15
29 Czech Republic . . 3 6 4 13
30 Turkey . 1 2 6 1 10
31 USSR 10 . . . . 10
32 Romania 4 2 1 . 2 9
33 Sri Lanka 1 1 3 1 3 9
34 Tunisia . . . 7 1 8
35 Yugoslavia 5 1 2 . . 8
36 Egypt 1 4 1 . 1 7
37 Slovenia 2 3 1 . 1 7
38 Austria . . 1 4 1 6
39 Algeria . . . 2 2 4
40 Brazil 1 . . . 3 4
41 Denmark . 2 1 1 . 4
42 Republic of Serbia . . . 2 2 4
43 Singapore . . 2 2 . 4
44 Bangladesh . 3 . . . 3
45 Belgium 1 1 . 1 . 3
46 Israel 1 . 1 . 1 3
47 Malaysia . . . 2 1 3
48 Serbia Montenegro . . 3 . . 3
49 Bulgaria . . 1 . 1 2
50 Indonesia . . . 2 . 2
51 Iran, Islamic Republic of . . . . 2 2

Number of publications, full counts


Bar chart of publication_year

Share of the total number of publications in the field, full counts (%)

Obs Country 1990-1994 1995-1999 2000-2004 2005-2009 2010-2014 All years
1 All countries 100.0 100.0 100.0 100.0 100.0 100.0
2 United States 31.9 35.6 34.6 34.4 30.4 33.6
3 France 9.1 7.9 8.3 12.6 11.6 9.9
4 Poland 7.9 7.2 13.6 8.5 5.1 8.6
5 Sweden 3.9 7.9 6.8 6.2 11.9 7.5
6 China 0.8 3.5 3.8 3.6 14.2 5.3
7 Switzerland 9.4 4.4 3.3 4.1 0.3 4.0
8 Russian Federation 4.3 4.4 3.3 3.1 4.3 3.8
9 Germany 1.2 4.7 2.3 4.4 5.7 3.8
10 Netherlands 4.3 4.7 2.3 4.1 3.4 3.7
11 Croatia 2.0 2.0 3.3 4.4 5.4 3.5
12 Japan 5.5 4.7 2.5 1.5 3.1 3.3
13 Australia 2.4 3.5 3.8 3.3 1.7 3.0
14 Pakistan . 1.2 2.0 2.1 6.5 2.4
15 Ukraine 0.8 3.5 1.8 2.6 1.7 2.2
16 Finland . 1.7 4.3 2.8 0.9 2.1
17 Hungary 2.0 1.5 4.8 1.3 0.3 2.0
18 Italy 5.9 1.0 1.8 0.8 2.0 2.0
19 United Kingdom 2.4 2.5 1.3 2.1 2.0 2.0
20 Argentina 1.2 2.2 0.3 2.1 2.6 1.7
21 India 2.4 0.5 1.3 2.3 2.0 1.6
22 Taiwan 2.0 1.7 2.0 0.5 . 1.2
23 Greece 0.4 0.5 0.8 2.8 0.6 1.1
24 New Zealand . 2.0 1.8 1.0 . 1.1
25 Spain 0.8 0.7 0.5 1.5 1.7 1.1
26 Korea, Republic of 0.4 0.7 1.0 1.0 1.4 0.9
27 Canada 0.4 1.0 0.3 1.0 1.7 0.9
28 Mexico 0.4 . 0.3 1.0 2.6 0.8
29 Czech Republic . . 0.8 1.5 1.1 0.7
30 Turkey . 0.2 0.5 1.5 0.3 0.6
31 USSR 3.9 . . . . 0.6
32 Romania 1.6 0.5 0.3 . 0.6 0.5
33 Sri Lanka 0.4 0.2 0.8 0.3 0.9 0.5
34 Tunisia . . . 1.8 0.3 0.4
35 Yugoslavia 2.0 0.2 0.5 . . 0.4
36 Egypt 0.4 1.0 0.3 . 0.3 0.4
37 Slovenia 0.8 0.7 0.3 . 0.3 0.4
38 Austria . . 0.3 1.0 0.3 0.3
39 Algeria . . . 0.5 0.6 0.2
40 Brazil 0.4 . . . 0.9 0.2
41 Denmark . 0.5 0.3 0.3 . 0.2
42 Republic of Serbia . . . 0.5 0.6 0.2
43 Singapore . . 0.5 0.5 . 0.2
44 Bangladesh . 0.7 . . . 0.2
45 Belgium 0.4 0.2 . 0.3 . 0.2
46 Israel 0.4 . 0.3 . 0.3 0.2
47 Malaysia . . . 0.5 0.3 0.2
48 Serbia Montenegro . . 0.8 . . 0.2
49 Bulgaria . . 0.3 . 0.3 0.1
50 Indonesia . . . 0.5 . 0.1
51 Iran, Islamic Republic of . . . . 0.6 0.1

Share of the total number of publications in the field, full counts (%)


Bar chart of publication_year

Number of publications among 10% most cited in field, full counts

Obs Country 1990-1994 1995-1999 2000-2004 2005-2009 2010-2014 All years
1 All countries 53.9 94.4 61.0 39.4 24.3 273.1
2 United States 27.0 44.3 36.5 15.2 13.0 135.9
3 France 7.8 5.0 4.5 5.9 2.7 26.0
4 Poland 0.7 1.3 3.0 1.0 1.7 7.7
5 Sweden 3.0 7.7 3.0 4.3 0.7 18.6
6 China 0.0 1.5 2.0 1.0 6.2 10.7
7 Switzerland 11.3 9.3 0.5 2.0 1.0 24.2
8 Russian Federation 0.0 0.0 2.3 1.0 0.0 3.3
9 Germany 0.0 1.5 0.0 2.0 1.7 5.2
10 Netherlands 3.0 12.3 2.0 6.8 2.5 26.7
11 Croatia 0.3 0.0 0.0 0.0 1.2 1.5
12 Japan 0.0 3.0 0.0 0.0 0.0 3.0
13 Australia 4.0 7.0 3.3 0.0 0.7 15.1
14 Pakistan . 0.0 1.0 0.0 0.0 1.0
15 Ukraine 0.0 0.0 0.0 0.0 0.0 0.0
16 Finland . 0.0 1.0 0.0 1.0 2.0
17 Hungary 0.0 0.0 0.0 0.0 0.0 0.0
18 Italy 0.0 0.0 0.0 0.0 0.7 0.7
19 United Kingdom 2.0 2.5 2.0 0.0 0.9 7.4
20 Argentina 0.0 3.0 0.0 3.0 0.0 6.0
21 India 0.0 0.0 0.0 0.0 0.7 0.7
22 Taiwan 0.0 0.0 0.0 0.0 . 0.0
23 Greece 0.0 0.0 1.0 0.0 0.0 1.0
24 New Zealand . 3.3 2.0 1.0 . 6.3
25 Spain 0.0 1.0 0.0 2.0 1.0 4.0
26 Korea, Republic of 0.0 0.0 0.0 0.0 1.8 1.8
27 Canada 0.0 0.0 0.0 2.0 1.7 3.7
28 Mexico 0.0 . 0.0 0.0 0.0 0.0
29 Czech Republic . . 3.0 0.0 0.0 3.0
30 Turkey . 0.0 1.0 2.0 0.0 3.0
31 USSR 0.0 . . . . 0.0
32 Romania 0.0 0.0 0.0 . 0.0 0.0
33 Sri Lanka 0.0 0.0 0.0 0.0 0.0 0.0
34 Tunisia . . . 0.0 0.0 0.0
35 Yugoslavia 1.0 0.0 0.0 . . 1.0
36 Egypt 0.0 0.0 0.0 . 0.0 0.0
37 Slovenia 0.0 0.0 1.0 . 0.0 1.0
38 Austria . . 0.0 0.0 0.0 0.0
39 Algeria . . . 0.0 0.0 0.0
40 Brazil 0.0 . . . 0.0 0.0
41 Denmark . 0.0 0.0 0.0 . 0.0
42 Republic of Serbia . . . 0.0 0.0 0.0
43 Singapore . . 2.0 0.0 . 2.0
44 Bangladesh . 2.0 . . . 2.0
45 Belgium 1.0 1.0 . 0.0 . 2.0
46 Israel 0.0 . 0.0 . 0.0 0.0
47 Malaysia . . . 0.5 0.0 0.5
48 Serbia Montenegro . . 0.0 . . 0.0
49 Bulgaria . . 0.0 . 0.0 0.0
50 Indonesia . . . 0.0 . 0.0
51 Iran, Islamic Republic of . . . . 0.0 0.0

Number of publications among 10% most cited in field, full counts


Bar chart of publication_year

Share of publications among 10% most cited in field, fractionalized (%)

Obs Country 1990-1994 1995-1999 2000-2004 2005-2009 2010-2014 All years
1 All countries 21.2 23.3 15.4 10.1 6.9 15.2
2 United States 36.1 30.8 27.6 11.8 11.2 23.4
3 France 29.1 16.7 16.0 10.9 5.9 14.2
4 Poland 1.1 4.1 5.9 4.2 7.7 4.7
5 Sweden 18.8 26.7 8.3 19.0 1.0 12.8
6 China 0.0 8.6 10.6 5.2 9.6 8.7
7 Switzerland 41.5 48.5 6.7 9.8 100.0 32.6
8 Russian Federation 0.0 0.0 3.3 4.0 0.0 1.2
9 Germany 0.0 7.4 0.0 7.9 9.4 6.5
10 Netherlands 30.0 71.1 26.4 48.0 20.1 44.4
11 Croatia 8.3 0.0 0.0 0.0 2.7 1.3
12 Japan 0.0 13.5 0.0 0.0 0.0 4.4
13 Australia 66.7 50.0 19.3 0.0 5.7 29.1
14 Pakistan . 0.0 12.5 0.0 0.0 2.6
15 Ukraine 0.0 0.0 0.0 0.0 0.0 0.0
16 Finland . 0.0 5.0 0.0 37.5 4.1
17 Hungary 0.0 0.0 0.0 0.0 0.0 0.0
18 Italy 0.0 0.0 0.0 0.0 5.3 0.8
19 United Kingdom 27.3 29.1 66.7 0.0 6.9 23.6
20 Argentina 0.0 36.0 0.0 26.8 0.0 17.6
21 India 0.0 0.0 0.0 0.0 3.9 0.9
22 Taiwan 0.0 0.0 0.0 0.0 . 0.0
23 Greece 0.0 0.0 33.3 0.0 0.0 5.4
24 New Zealand . 44.4 30.8 25.0 . 35.2
25 Spain 0.0 33.3 0.0 29.2 21.4 20.7
26 Korea, Republic of 0.0 0.0 0.0 0.0 12.3 2.7
27 Canada 0.0 0.0 0.0 70.6 22.0 24.4
28 Mexico 0.0 . 0.0 0.0 0.0 0.0
29 Czech Republic . . 100.0 0.0 0.0 17.0
30 Turkey . 0.0 50.0 36.4 0.0 31.6
31 USSR 0.0 . . . . 0.0
32 Romania 0.0 0.0 0.0 . 0.0 0.0
33 Sri Lanka 0.0 0.0 0.0 0.0 0.0 0.0
34 Tunisia . . . 0.0 0.0 0.0
35 Yugoslavia 22.2 0.0 0.0 . . 13.3
36 Egypt 0.0 0.0 0.0 . 0.0 0.0
37 Slovenia 0.0 0.0 100.0 . 0.0 23.5
38 Austria . . 0.0 0.0 0.0 0.0
39 Algeria . . . 0.0 0.0 0.0
40 Brazil 0.0 . . . 0.0 0.0
41 Denmark . 0.0 0.0 0.0 . 0.0
42 Republic of Serbia . . . 0.0 0.0 0.0
43 Singapore . . 100.0 0.0 . 50.0
44 Bangladesh . 66.7 . . . 66.7
45 Belgium 100.0 100.0 . 0.0 . 92.3
46 Israel 0.0 . 0.0 . 0.0 0.0
47 Malaysia . . . 33.3 0.0 29.4
48 Serbia Montenegro . . 0.0 . . 0.0
49 Bulgaria . . 0.0 . 0.0 0.0
50 Indonesia . . . 0.0 . 0.0
51 Iran, Islamic Republic of . . . . 0.0 0.0

Share of publications among 10% most cited in field, fractionalized (%)


Bar chart of publication_year

Field normalized citation rate (cf), fractionalized

Obs Country 1990-1994 1995-1999 2000-2004 2005-2009 2010-2014 All years
1 All countries 1.54 1.70 1.22 0.96 0.79 1.23
2 United States 2.45 2.06 1.73 1.16 1.06 1.68
3 France 2.09 1.26 1.42 0.97 0.73 1.20
4 Poland 0.63 0.66 0.77 0.62 1.01 0.72
5 Sweden 1.98 1.99 1.20 1.28 0.63 1.27
6 China 0.17 0.68 0.58 0.82 0.82 0.74
7 Switzerland 2.66 3.34 1.02 1.43 2.63 2.35
8 Russian Federation 0.00 0.18 0.32 0.27 0.13 0.17
9 Germany 0.28 0.91 0.67 1.01 0.70 0.81
10 Netherlands 1.77 4.88 2.02 1.95 1.33 2.73
11 Croatia 1.16 0.48 0.47 0.54 0.37 0.53
12 Japan 0.25 1.14 0.39 0.47 0.50 0.63
13 Australia 3.55 1.92 1.34 0.68 0.92 1.62
14 Pakistan . 0.41 0.62 0.54 0.57 0.56
15 Ukraine 0.15 0.14 0.51 0.23 0.12 0.22
16 Finland . 0.97 0.76 0.41 3.68 0.88
17 Hungary 0.06 0.44 0.29 0.45 0.85 0.32
18 Italy 0.35 0.60 0.70 0.42 0.74 0.52
19 United Kingdom 1.56 1.80 2.53 0.76 0.99 1.50
20 Argentina 1.32 2.36 1.35 1.12 0.63 1.37
21 India 0.62 0.09 1.00 0.42 0.78 0.63
22 Taiwan 0.41 0.53 0.79 0.32 . 0.58
23 Greece 2.14 1.93 1.49 0.59 0.20 0.92
24 New Zealand . 3.91 2.75 1.19 . 2.89
25 Spain 0.00 3.07 0.23 1.92 1.48 1.58
26 Korea, Republic of 0.57 0.83 0.94 0.78 0.61 0.78
27 Canada 1.54 0.66 0.30 2.66 0.85 1.25
28 Mexico 0.21 . 1.53 1.22 0.68 0.89
29 Czech Republic . . 4.49 1.02 1.09 1.63
30 Turkey . 0.58 2.41 1.66 0.00 1.53
31 USSR 0.01 . . . . 0.01
32 Romania 0.99 1.05 0.24 . 0.11 0.67
33 Sri Lanka 0.00 0.42 0.82 0.15 0.28 0.44
34 Tunisia . . . 0.16 0.62 0.22
35 Yugoslavia 1.41 0.07 0.29 . . 0.93
36 Egypt 0.23 0.65 0.00 . 0.50 0.51
37 Slovenia 0.13 0.58 15.12 . 0.43 3.85
38 Austria . . 0.35 1.03 0.33 0.82
39 Algeria . . . 0.37 0.85 0.61
40 Brazil 0.05 . . . 0.15 0.12
41 Denmark . 1.44 1.14 1.91 . 1.49
42 Republic of Serbia . . . 0.77 0.13 0.45
43 Singapore . . 3.30 0.81 . 2.06
44 Bangladesh . 3.82 . . . 3.82
45 Belgium 3.20 2.37 . 2.24 . 2.74
46 Israel 0.29 . 1.19 . 0.21 0.79
47 Malaysia . . . 2.01 0.21 1.80
48 Serbia Montenegro . . 0.20 . . 0.20
49 Bulgaria . . 0.29 . 0.33 0.30
50 Indonesia . . . 0.09 . 0.09
51 Iran, Islamic Republic of . . . . 0.51 0.51

Field normalized citation rate (cf), fractionalized


Bar chart of publication_year