| All organizations |
254 |
405 |
396 |
390 |
352 |
1797 |
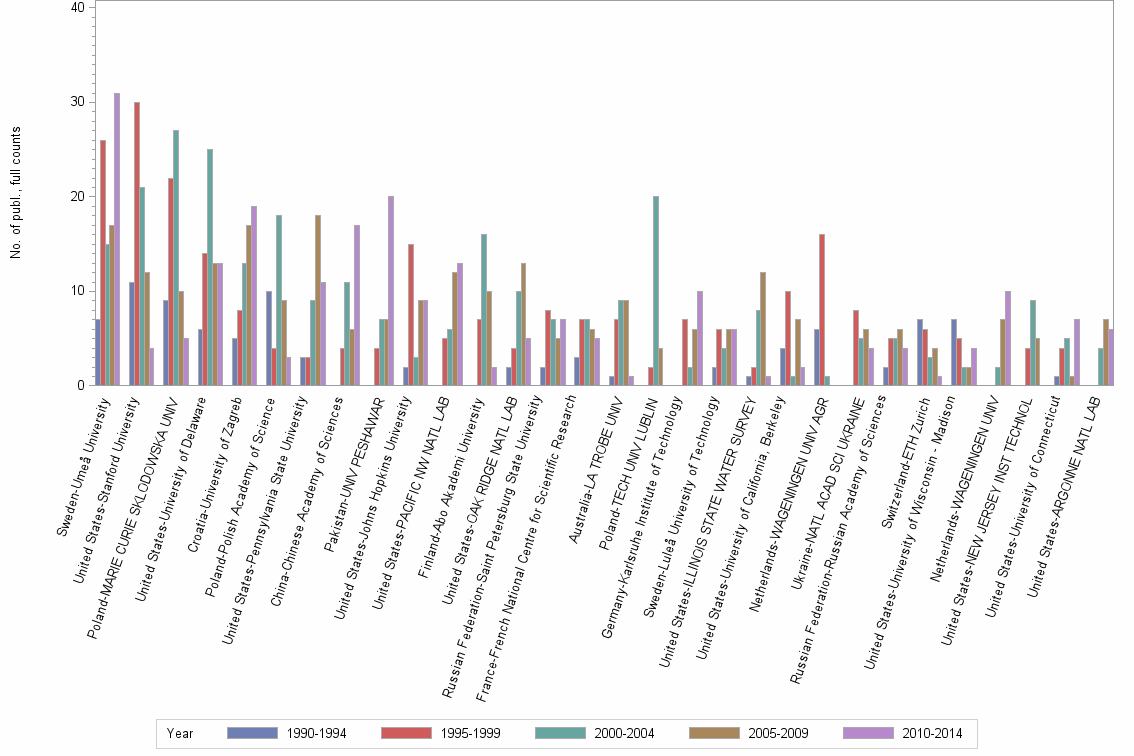
| Sweden-Umeå University |
7 |
26 |
15 |
17 |
31 |
96 |
| United States-Stanford University |
11 |
30 |
21 |
12 |
4 |
78 |
| Poland-MARIE CURIE SKLODOWSKA UNIV |
9 |
22 |
27 |
10 |
5 |
73 |
| United States-University of Delaware |
6 |
14 |
25 |
13 |
13 |
71 |
| Croatia-University of Zagreb |
5 |
8 |
13 |
17 |
19 |
62 |
| Poland-Polish Academy of Science |
10 |
4 |
18 |
9 |
3 |
44 |
| United States-Pennsylvania State University |
3 |
3 |
9 |
18 |
11 |
44 |
| China-Chinese Academy of Sciences |
. |
4 |
11 |
6 |
17 |
38 |
| Pakistan-UNIV PESHAWAR |
. |
4 |
7 |
7 |
20 |
38 |
| United States-Johns Hopkins University |
2 |
15 |
3 |
9 |
9 |
38 |
| United States-PACIFIC NW NATL LAB |
. |
5 |
6 |
12 |
13 |
36 |
| Finland-Abo Akademi University |
. |
7 |
16 |
10 |
2 |
35 |
| United States-OAK RIDGE NATL LAB |
2 |
4 |
10 |
13 |
5 |
34 |
| Russian Federation-Saint Petersburg State University |
2 |
8 |
7 |
5 |
7 |
29 |
| France-French National Centre for Scientific Research |
3 |
7 |
7 |
6 |
5 |
28 |
| Australia-LA TROBE UNIV |
1 |
7 |
9 |
9 |
1 |
27 |
| Poland-TECH UNIV LUBLIN |
. |
2 |
20 |
4 |
. |
26 |
| Germany-Karlsruhe Institute of Technology |
. |
7 |
2 |
6 |
10 |
25 |
| Sweden-Luleå University of Technology |
2 |
6 |
4 |
6 |
6 |
24 |
| United States-ILLINOIS STATE WATER SURVEY |
1 |
2 |
8 |
12 |
1 |
24 |
| United States-University of California, Berkeley |
4 |
10 |
1 |
7 |
2 |
24 |
| Netherlands-WAGENINGEN UNIV AGR |
6 |
16 |
1 |
. |
. |
23 |
| Ukraine-NATL ACAD SCI UKRAINE |
. |
8 |
5 |
6 |
4 |
23 |
| Russian Federation-Russian Academy of Sciences |
2 |
5 |
5 |
6 |
4 |
22 |
| Switzerland-ETH Zurich |
7 |
6 |
3 |
4 |
1 |
21 |
| United States-University of Wisconsin - Madison |
7 |
5 |
2 |
2 |
4 |
20 |
| Netherlands-WAGENINGEN UNIV |
. |
. |
2 |
7 |
10 |
19 |
| United States-NEW JERSEY INST TECHNOL |
. |
4 |
9 |
5 |
. |
18 |
| United States-University of Connecticut |
1 |
4 |
5 |
1 |
7 |
18 |
| United States-ARGONNE NATL LAB |
. |
. |
4 |
7 |
6 |
17 |
| Japan-Hokkaido University |
7 |
5 |
2 |
1 |
1 |
16 |
| United States-United States Environmental Protection Agency |
. |
1 |
6 |
5 |
4 |
16 |
| France-University of Paris-Sud 11 |
. |
2 |
3 |
6 |
4 |
15 |
| Italy-University of Milan |
11 |
3 |
1 |
. |
. |
15 |
| France-University Pierre and Marie Curie |
. |
1 |
3 |
7 |
3 |
14 |
| Hungary-HUNGARIAN ACAD SCI |
. |
. |
14 |
. |
. |
14 |
| New Zealand-University of Otago |
. |
8 |
5 |
1 |
. |
14 |
| Poland-Lublin Univ Technol |
. |
. |
2 |
7 |
5 |
14 |
| Switzerland-SWISS FED INST TECHNOL |
5 |
3 |
2 |
4 |
. |
14 |
| United States-BROOKHAVEN NATL LAB |
2 |
3 |
2 |
1 |
6 |
14 |
| United States-Stony Brook University, The State University of New York |
1 |
. |
4 |
2 |
7 |
14 |
| United States-Syracuse University |
8 |
6 |
. |
. |
. |
14 |
| United States-University of California, Davis |
3 |
1 |
4 |
2 |
4 |
14 |
| Argentina-UNIV NACL SUR |
. |
. |
. |
7 |
6 |
13 |
| France-INPL |
. |
2 |
6 |
4 |
1 |
13 |
| Taiwan-National Taiwan University |
4 |
3 |
5 |
1 |
. |
13 |
| Switzerland-University of Basel |
9 |
2 |
1 |
. |
. |
12 |
| United States-Clarkson University |
10 |
1 |
1 |
. |
. |
12 |
| United States-University of Michigan |
2 |
4 |
3 |
1 |
2 |
12 |
| United States-Vanderbilt University |
. |
. |
3 |
6 |
3 |
12 |
| United States-Texas Tech University |
. |
. |
4 |
4 |
3 |
11 |
| United States-United States Department of Agriculture |
4 |
2 |
. |
3 |
2 |
11 |
| Czech Republic-Academy of Sciences of the Czech Republic |
. |
. |
3 |
5 |
2 |
10 |
| Hungary-UNIV DEBRECEN |
. |
. |
8 |
2 |
. |
10 |
| India-REG RES LAB |
3 |
. |
4 |
3 |
. |
10 |
| Switzerland-PAUL SCHERRER INST |
. |
3 |
3 |
4 |
. |
10 |
| United States-Ohio State University |
. |
2 |
1 |
4 |
3 |
10 |
| United States-United States Geological Survey |
2 |
3 |
1 |
4 |
. |
10 |
| United States-Virginia Polytechnic Institute and State University |
1 |
2 |
4 |
3 |
. |
10 |
| China-Nanjing University |
. |
. |
. |
1 |
8 |
9 |
| France-Henri Poincaré University |
. |
. |
2 |
5 |
2 |
9 |
| France-University of Strasbourg |
. |
5 |
4 |
. |
. |
9 |
| Japan-Kyoto University |
1 |
5 |
3 |
. |
. |
9 |
| Mexico-National Autonomous University of Mexico |
. |
. |
1 |
2 |
6 |
9 |
| Netherlands-Wageningen University and Research Centre |
. |
. |
4 |
5 |
. |
9 |
| United Kingdom-University of Bristol |
. |
3 |
4 |
2 |
. |
9 |
| United States-Carnegie Institution |
. |
. |
. |
2 |
7 |
9 |
| United States-Carnegie Mellon University |
. |
7 |
. |
1 |
1 |
9 |
| United States-Columbia University |
. |
. |
1 |
2 |
6 |
9 |
| United States-Northwestern University |
. |
. |
5 |
3 |
1 |
9 |
| United States-Pacific NW Lab |
5 |
4 |
. |
. |
. |
9 |
| United States-SANDIA NATL LABS |
. |
. |
2 |
4 |
3 |
9 |
| United States-SLAC |
. |
. |
4 |
5 |
. |
9 |
| United States-University of Alaska Fairbanks |
. |
. |
4 |
4 |
1 |
9 |
| United States-University of Illinois at Chicago |
. |
1 |
3 |
3 |
2 |
9 |
| France-ENSG |
1 |
6 |
1 |
. |
. |
8 |
| France-UNIV GRENOBLE 1 |
2 |
2 |
3 |
. |
1 |
8 |
| Greece-University of Patras |
1 |
1 |
2 |
4 |
. |
8 |
| Korea, Republic of-KOREA ATOMIC ENERGY RESEARCH INSTITUTE |
1 |
3 |
3 |
1 |
. |
8 |
| Sweden-University of Gothenburg |
. |
1 |
5 |
1 |
1 |
8 |
| United States-DuPont |
2 |
1 |
4 |
1 |
. |
8 |
| United States-IIT |
1 |
3 |
2 |
1 |
1 |
8 |
| Argentina-UNIV NACL CORDOBA |
. |
3 |
1 |
. |
3 |
7 |
| China-Univ Jinan |
. |
. |
. |
. |
7 |
7 |
| France-UNIV REIMS |
. |
4 |
1 |
2 |
. |
7 |
| Germany-University of Jena |
. |
6 |
1 |
. |
. |
7 |
| Greece-Univ Ioannina |
. |
. |
. |
6 |
1 |
7 |
| Japan-University of Tokyo |
. |
2 |
3 |
1 |
1 |
7 |
| Spain-University of Santiago de Compostela |
. |
. |
. |
2 |
5 |
7 |
| Switzerland-SWISS FED INST ENVIRONM SCI & TECHNOL |
3 |
2 |
2 |
. |
. |
7 |
| United States-Arizona State University |
. |
4 |
1 |
1 |
1 |
7 |
| United States-RUTGERS STATE UNIV |
1 |
. |
. |
2 |
4 |
7 |
| United States-University of Chicago |
. |
. |
1 |
3 |
3 |
7 |
| United States-University of Idaho |
2 |
1 |
3 |
1 |
. |
7 |
| Argentina-COMIS NACL ENERGIA ATOM |
1 |
3 |
. |
. |
2 |
6 |
| China-HUAZHONG AGR UNIV |
. |
. |
. |
. |
6 |
6 |
| China-OCEAN UNIV QINGDAO |
1 |
5 |
. |
. |
. |
6 |
| Czech Republic-UNIV S BOHEMIA |
. |
. |
2 |
3 |
1 |
6 |
| France-ANDRA |
. |
. |
2 |
3 |
1 |
6 |
| France-Atomic Energy and Alternative Energies Commission |
2 |
. |
1 |
3 |
. |
6 |
| Italy-National Research Council |
5 |
. |
1 |
. |
. |
6 |
| Italy-University of Naples Federico II |
. |
. |
3 |
. |
3 |
6 |
| Japan-ASAHIKAWA NATL COLL TECHNOL |
4 |
2 |
. |
. |
. |
6 |
| Japan-Kanazawa University |
. |
. |
. |
1 |
5 |
6 |
| Netherlands-AGR UNIV WAGENINGEN |
3 |
3 |
. |
. |
. |
6 |
| Poland-Jozef Pilsudski Acad Phys Educ |
. |
. |
3 |
2 |
1 |
6 |
| Romania-ROMANIAN ACAD |
4 |
1 |
1 |
. |
. |
6 |
| Sri Lanka-INST FUNDAMENTAL STUDIES |
1 |
1 |
2 |
. |
2 |
6 |
| Tunisia-ECOLE SUPER SCI & TECH TUNIS |
. |
. |
. |
6 |
. |
6 |
| Turkey-Istanbul University |
. |
. |
1 |
4 |
1 |
6 |
| United States-Georgia Institute of Technology |
. |
3 |
3 |
. |
. |
6 |
| United States-University of Wyoming |
. |
3 |
2 |
. |
1 |
6 |
| United States-Western Michigan University |
. |
. |
. |
3 |
3 |
6 |
| USSR-Saint Petersburg State University |
6 |
. |
. |
. |
. |
6 |