Lev2: FERRITES//HEXAFERRITES//BARIUM FERRITE - Statistics for Countries |
Statistics per Country |
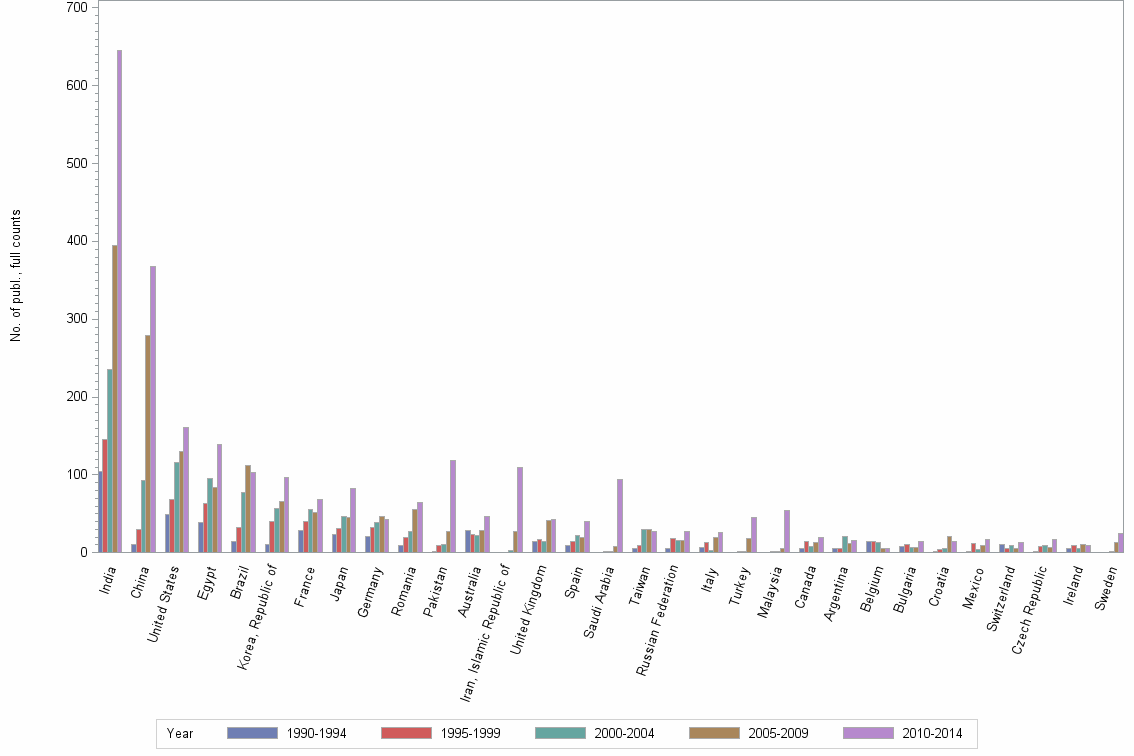
Number of publications, full counts |
| Obs | Country | 1990-1994 | 1995-1999 | 2000-2004 | 2005-2009 | 2010-2014 | All years |
|---|---|---|---|---|---|---|---|
| 1 | All countries | 431 | 628 | 960 | 1443 | 2200 | 5662 |
| 2 | India | 104 | 146 | 235 | 395 | 645 | 1525 |
| 3 | China | 11 | 30 | 93 | 279 | 368 | 781 |
| 4 | United States | 49 | 68 | 116 | 130 | 161 | 524 |
| 5 | Egypt | 39 | 63 | 95 | 84 | 139 | 420 |
| 6 | Brazil | 15 | 33 | 77 | 112 | 103 | 340 |
| 7 | Korea, Republic of | 10 | 40 | 57 | 66 | 97 | 270 |
| 8 | France | 28 | 40 | 55 | 52 | 68 | 243 |
| 9 | Japan | 24 | 31 | 47 | 45 | 82 | 229 |
| 10 | Germany | 21 | 32 | 39 | 46 | 43 | 181 |
| 11 | Romania | 9 | 20 | 27 | 55 | 65 | 176 |
| 12 | Pakistan | 2 | 9 | 10 | 27 | 118 | 166 |
| 13 | Australia | 28 | 24 | 22 | 28 | 46 | 148 |
| 14 | Iran, Islamic Republic of | . | . | 3 | 27 | 109 | 139 |
| 15 | United Kingdom | 15 | 17 | 15 | 41 | 43 | 131 |
| 16 | Spain | 9 | 15 | 22 | 20 | 40 | 106 |
| 17 | Saudi Arabia | . | 1 | 2 | 8 | 94 | 105 |
| 18 | Taiwan | 5 | 9 | 30 | 30 | 27 | 101 |
| 19 | Russian Federation | 6 | 18 | 16 | 16 | 27 | 83 |
| 20 | Italy | 7 | 13 | 3 | 20 | 26 | 69 |
| 21 | Turkey | . | 1 | 1 | 18 | 45 | 65 |
| 22 | Malaysia | . | 1 | 1 | 6 | 54 | 62 |
| 23 | Canada | 5 | 15 | 8 | 13 | 20 | 61 |
| 24 | Argentina | 5 | 5 | 21 | 12 | 16 | 59 |
| 25 | Belgium | 15 | 15 | 13 | 5 | 6 | 54 |
| 26 | Bulgaria | 8 | 11 | 7 | 7 | 14 | 47 |
| 27 | Croatia | 1 | 4 | 5 | 21 | 15 | 46 |
| 28 | Mexico | 1 | 12 | 4 | 9 | 17 | 43 |
| 29 | Switzerland | 11 | 5 | 9 | 5 | 13 | 43 |
| 30 | Czech Republic | 1 | 8 | 9 | 7 | 17 | 42 |
| 31 | Ireland | 6 | 9 | 6 | 10 | 9 | 40 |
| 32 | Sweden | . | . | 1 | 13 | 25 | 39 |
| 33 | Poland | 9 | 3 | 9 | 7 | 10 | 38 |
| 34 | Singapore | . | 2 | 12 | 14 | 10 | 38 |
| 35 | Denmark | 6 | 7 | 14 | 9 | 1 | 37 |
| 36 | Bangladesh | . | . | 4 | 11 | 19 | 34 |
| 37 | Slovak Republic | . | 1 | 7 | 8 | 15 | 31 |
| 38 | Thailand | . | . | . | 11 | 20 | 31 |
| 39 | Oman | 3 | 1 | 3 | 18 | 4 | 29 |
| 40 | Republic of Serbia | . | . | . | 7 | 22 | 29 |
| 41 | Slovenia | . | 4 | 6 | 5 | 13 | 28 |
| 42 | Netherlands | 1 | 8 | 4 | 3 | 8 | 24 |
| 43 | South Africa | . | . | 2 | 8 | 14 | 24 |
| 44 | Austria | . | 1 | . | 4 | 17 | 22 |
| 45 | Latvia | 1 | 1 | . | . | 16 | 18 |
| 46 | Colombia | . | 1 | 10 | 3 | 3 | 17 |
| 47 | Greece | 1 | 1 | 4 | 4 | 7 | 17 |
| 48 | Israel | 1 | 4 | 1 | 7 | 3 | 16 |
| 49 | Portugal | 1 | . | 2 | 4 | 9 | 16 |
| 50 | Venezuela | 4 | 3 | 2 | . | 7 | 16 |
| 51 | Tunisia | . | . | 1 | 5 | 9 | 15 |
Number of publications, full counts |