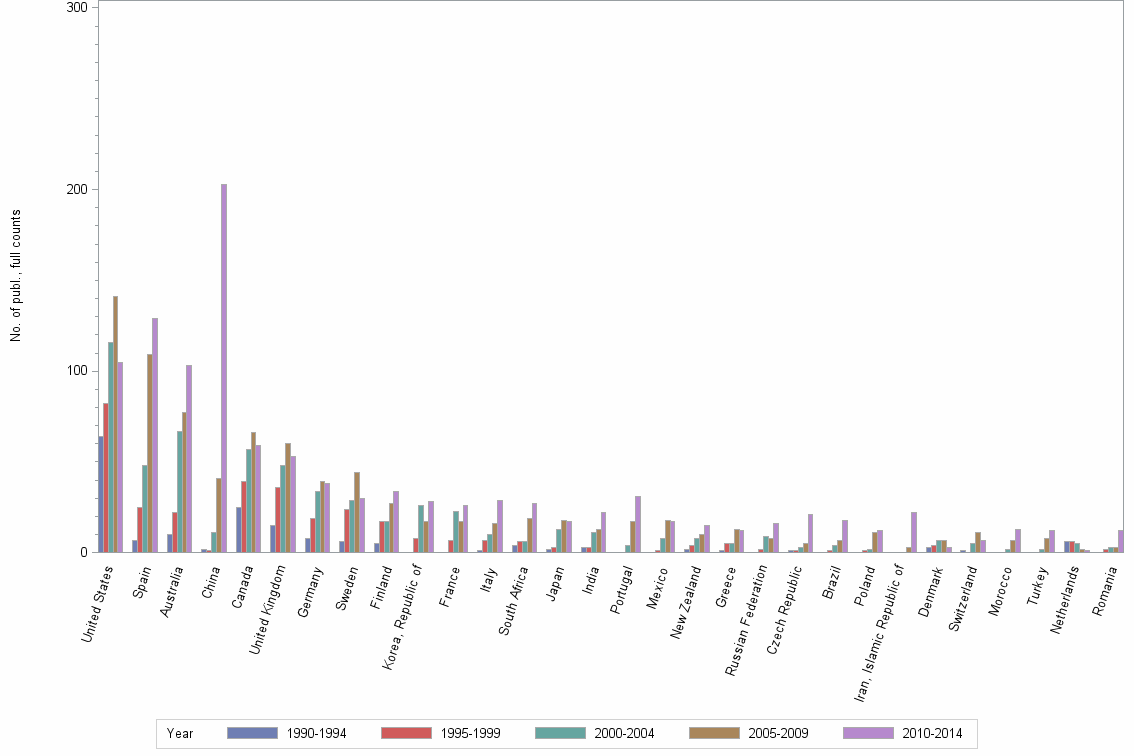
Lev2: ACID MINE DRAINAGE//ACID SULFATE SOIL//ACID SULFATE SOILS - Statistics for Countries

Statistics per Country

Number of publications, full counts

Obs Country 1990-1994 1995-1999 2000-2004 2005-2009 2010-2014 All years
1 All countries 164 321 532 733 982 2732
2 United States 64 82 116 141 105 508
3 Spain 7 25 48 109 129 318
4 Australia 10 22 67 77 103 279
5 China 2 1 11 41 203 258
6 Canada 25 39 57 66 59 246
7 United Kingdom 15 36 48 60 53 212
8 Germany 8 19 34 39 38 138
9 Sweden 6 24 29 44 30 133
10 Finland 5 17 17 27 34 100
11 Korea, Republic of . 8 26 17 28 79
12 France . 7 23 17 26 73
13 Italy 1 7 10 16 29 63
14 South Africa 4 6 6 19 27 62
15 Japan 2 3 13 18 17 53
16 India 3 3 11 13 22 52
17 Portugal . . 4 17 31 52
18 Mexico . 1 8 18 17 44
19 New Zealand 2 4 8 10 15 39
20 Greece 1 5 5 13 12 36
21 Russian Federation . 2 9 8 16 35
22 Czech Republic 1 1 3 5 21 31
23 Brazil . 1 4 7 18 30
24 Poland . 1 2 11 12 26
25 Iran, Islamic Republic of . . . 3 22 25
26 Denmark 3 4 7 7 3 24
27 Switzerland 1 . 5 11 7 24
28 Morocco . . 2 7 13 22
29 Turkey . . 2 8 12 22
30 Netherlands 6 6 5 2 1 20
31 Romania . 2 3 3 12 20
32 Viet Nam 1 2 6 4 4 17
33 Malaysia 1 2 2 3 7 15
34 Norway 3 3 1 5 3 15
35 Chile . . . 2 10 12
36 Ireland . 10 2 . . 12
37 Slovak Republic . 2 2 2 6 12
38 Thailand 3 . 1 3 5 12
39 Indonesia 2 1 . 3 5 11
40 Argentina . . 2 4 4 10
41 Belgium . . 4 1 5 10
42 Philippines 1 5 2 . 2 10
43 Zimbabwe 1 . 2 7 . 10
44 Bangladesh 1 2 . 2 4 9
45 Hungary 1 1 . 2 5 9
46 Bulgaria . . 3 3 2 8
47 Austria . . 1 6 . 7
48 Taiwan . . 1 2 3 6
49 Tunisia . . . 1 5 6
50 Croatia . . . . 5 5
51 Pakistan 1 . . . 4 5
52 Republic of Serbia . . . 1 4 5

Number of publications, full counts


Bar chart of publication_year

Share of the total number of publications in the field, full counts (%)

Obs Country 1990-1994 1995-1999 2000-2004 2005-2009 2010-2014 All years
1 All countries 100.0 100.0 100.0 100.0 100.0 100.0
2 United States 39.0 25.5 21.8 19.2 10.7 18.6
3 Spain 4.3 7.8 9.0 14.9 13.1 11.6
4 Australia 6.1 6.9 12.6 10.5 10.5 10.2
5 China 1.2 0.3 2.1 5.6 20.7 9.4
6 Canada 15.2 12.1 10.7 9.0 6.0 9.0
7 United Kingdom 9.1 11.2 9.0 8.2 5.4 7.8
8 Germany 4.9 5.9 6.4 5.3 3.9 5.1
9 Sweden 3.7 7.5 5.5 6.0 3.1 4.9
10 Finland 3.0 5.3 3.2 3.7 3.5 3.7
11 Korea, Republic of . 2.5 4.9 2.3 2.9 2.9
12 France . 2.2 4.3 2.3 2.6 2.7
13 Italy 0.6 2.2 1.9 2.2 3.0 2.3
14 South Africa 2.4 1.9 1.1 2.6 2.7 2.3
15 Japan 1.2 0.9 2.4 2.5 1.7 1.9
16 India 1.8 0.9 2.1 1.8 2.2 1.9
17 Portugal . . 0.8 2.3 3.2 1.9
18 Mexico . 0.3 1.5 2.5 1.7 1.6
19 New Zealand 1.2 1.2 1.5 1.4 1.5 1.4
20 Greece 0.6 1.6 0.9 1.8 1.2 1.3
21 Russian Federation . 0.6 1.7 1.1 1.6 1.3
22 Czech Republic 0.6 0.3 0.6 0.7 2.1 1.1
23 Brazil . 0.3 0.8 1.0 1.8 1.1
24 Poland . 0.3 0.4 1.5 1.2 1.0
25 Iran, Islamic Republic of . . . 0.4 2.2 0.9
26 Denmark 1.8 1.2 1.3 1.0 0.3 0.9
27 Switzerland 0.6 . 0.9 1.5 0.7 0.9
28 Morocco . . 0.4 1.0 1.3 0.8
29 Turkey . . 0.4 1.1 1.2 0.8
30 Netherlands 3.7 1.9 0.9 0.3 0.1 0.7
31 Romania . 0.6 0.6 0.4 1.2 0.7
32 Viet Nam 0.6 0.6 1.1 0.5 0.4 0.6
33 Malaysia 0.6 0.6 0.4 0.4 0.7 0.5
34 Norway 1.8 0.9 0.2 0.7 0.3 0.5
35 Chile . . . 0.3 1.0 0.4
36 Ireland . 3.1 0.4 . . 0.4
37 Slovak Republic . 0.6 0.4 0.3 0.6 0.4
38 Thailand 1.8 . 0.2 0.4 0.5 0.4
39 Indonesia 1.2 0.3 . 0.4 0.5 0.4
40 Argentina . . 0.4 0.5 0.4 0.4
41 Belgium . . 0.8 0.1 0.5 0.4
42 Philippines 0.6 1.6 0.4 . 0.2 0.4
43 Zimbabwe 0.6 . 0.4 1.0 . 0.4
44 Bangladesh 0.6 0.6 . 0.3 0.4 0.3
45 Hungary 0.6 0.3 . 0.3 0.5 0.3
46 Bulgaria . . 0.6 0.4 0.2 0.3
47 Austria . . 0.2 0.8 . 0.3
48 Taiwan . . 0.2 0.3 0.3 0.2
49 Tunisia . . . 0.1 0.5 0.2
50 Croatia . . . . 0.5 0.2
51 Pakistan 0.6 . . . 0.4 0.2
52 Republic of Serbia . . . 0.1 0.4 0.2

Share of the total number of publications in the field, full counts (%)


Bar chart of publication_year

Number of publications among 10% most cited in field, full counts

Obs Country 1990-1994 1995-1999 2000-2004 2005-2009 2010-2014 All years
1 All countries 17.8 42.0 45.4 47.3 25.3 177.8
2 United States 9.5 14.3 11.8 12.0 4.0 51.7
3 Spain 0.0 7.0 7.5 13.3 5.2 33.0
4 Australia 1.2 1.5 1.2 5.8 5.5 15.2
5 China 0.0 0.0 1.0 3.3 3.2 7.6
6 Canada 6.3 5.5 5.2 2.3 3.1 22.5
7 United Kingdom 1.0 7.3 4.0 4.5 2.7 19.5
8 Germany 2.0 5.3 5.5 2.7 0.0 15.5
9 Sweden 0.0 0.3 1.0 1.0 0.0 2.3
10 Finland 1.0 0.0 1.1 2.7 0.0 4.8
11 Korea, Republic of . 1.0 2.0 0.0 0.0 3.0
12 France . 2.0 5.0 1.0 3.3 11.3
13 Italy 0.0 1.0 1.0 1.0 1.0 4.0
14 South Africa 0.0 0.0 2.0 0.6 0.7 3.4
15 Japan 0.0 0.0 2.5 0.0 0.0 2.5
16 India 0.0 0.0 0.7 0.0 1.0 1.7
17 Portugal . . 1.0 3.0 0.0 4.0
18 Mexico . 0.0 1.0 1.0 1.0 3.0
19 New Zealand 0.0 1.0 1.0 0.0 0.0 2.0
20 Greece 0.0 1.0 1.3 0.0 0.0 2.3
21 Russian Federation . 0.0 1.0 0.0 0.3 1.3
22 Czech Republic 0.0 0.0 0.5 0.0 0.0 0.5
23 Brazil . 0.0 0.0 0.0 0.6 0.6
24 Poland . 0.0 0.0 0.0 0.0 0.0
25 Iran, Islamic Republic of . . . 0.0 0.0 0.0
26 Denmark 0.8 0.0 0.0 0.0 0.0 0.8
27 Switzerland 0.0 . 3.0 0.0 0.0 3.0
28 Morocco . . 0.0 0.0 0.0 0.0
29 Turkey . . 0.0 1.0 0.1 1.1
30 Netherlands 0.0 1.3 0.0 0.0 0.0 1.3
31 Romania . 0.3 0.0 0.0 0.0 0.3
32 Viet Nam 0.0 0.0 0.0 0.0 0.0 0.0
33 Malaysia 0.0 0.0 0.0 0.0 0.0 0.0
34 Norway 0.0 1.0 0.0 0.0 0.0 1.0
35 Chile . . . 0.0 0.2 0.2
36 Ireland . 2.0 0.0 . . 2.0
37 Slovak Republic . 0.0 0.0 0.0 0.0 0.0
38 Thailand 0.0 . 0.0 0.0 0.0 0.0
39 Indonesia 0.0 0.0 . 0.0 0.0 0.0
40 Argentina . . 0.0 0.0 0.0 0.0
41 Belgium . . 0.0 0.3 1.0 1.3
42 Philippines 0.0 0.3 0.0 . 0.0 0.3
43 Zimbabwe 0.0 . 0.0 0.0 . 0.0
44 Bangladesh 0.0 0.0 . 0.0 0.0 0.0
45 Hungary 0.0 0.0 . 0.0 0.0 0.0
46 Bulgaria . . 0.0 0.0 0.0 0.0
47 Austria . . 0.0 0.0 . 0.0
48 Taiwan . . 0.0 0.5 0.0 0.5
49 Tunisia . . . 0.0 0.0 0.0
50 Croatia . . . . 1.0 1.0
51 Pakistan 0.0 . . . 0.0 0.0
52 Republic of Serbia . . . 0.0 0.0 0.0

Number of publications among 10% most cited in field, full counts


Bar chart of publication_year

Share of publications among 10% most cited in field, fractionalized (%)

Obs Country 1990-1994 1995-1999 2000-2004 2005-2009 2010-2014 All years
1 All countries 10.9 13.1 8.5 6.5 2.6 6.5
2 United States 14.0 14.8 7.7 8.2 4.8 9.4
3 Spain 0.0 24.5 15.1 12.9 3.6 10.3
4 Australia 11.5 7.0 1.7 8.2 5.1 5.5
5 China 0.0 0.0 7.8 7.3 1.7 2.7
6 Canada 25.3 13.5 8.4 4.2 5.5 9.4
7 United Kingdom 6.9 18.4 5.5 6.8 1.9 7.4
8 Germany 14.7 25.3 11.1 4.9 0.0 8.6
9 Sweden 0.0 1.2 2.7 3.2 0.0 1.8
10 Finland 9.1 0.0 2.4 10.5 0.0 3.1
11 Korea, Republic of . 12.5 7.8 0.0 0.0 4.3
12 France . 13.3 24.3 6.8 13.8 15.1
13 Italy 0.0 15.4 10.0 7.0 0.7 5.6
14 South Africa 0.0 0.0 31.3 3.1 2.8 5.0
15 Japan 0.0 0.0 20.8 0.0 0.0 6.4
16 India 0.0 0.0 6.3 0.0 5.3 3.5
17 Portugal . . 18.5 13.0 0.0 5.6
18 Mexico . 0.0 12.8 6.0 6.3 7.3
19 New Zealand 0.0 33.3 4.9 0.0 0.0 4.4
20 Greece 0.0 20.3 39.6 0.0 0.0 7.4
21 Russian Federation . 0.0 7.7 0.0 0.9 2.1
22 Czech Republic 0.0 0.0 13.2 0.0 0.0 1.2
23 Brazil . 0.0 0.0 0.0 4.0 2.3
24 Poland . 0.0 0.0 0.0 0.0 0.0
25 Iran, Islamic Republic of . . . 0.0 0.0 0.0
26 Denmark 19.7 0.0 0.0 0.0 0.0 2.1
27 Switzerland 0.0 . 60.0 0.0 0.0 18.3
28 Morocco . . 0.0 0.0 0.0 0.0
29 Turkey . . 0.0 12.5 0.9 5.3
30 Netherlands 0.0 22.2 0.0 0.0 0.0 6.0
31 Romania . 13.3 0.0 0.0 0.0 0.8
32 Viet Nam 0.0 0.0 0.0 0.0 0.0 0.0
33 Malaysia 0.0 0.0 0.0 0.0 0.0 0.0
34 Norway 0.0 18.2 0.0 0.0 0.0 4.0
35 Chile . . . 0.0 0.9 0.6
36 Ireland . 20.0 0.0 . . 17.6
37 Slovak Republic . 0.0 0.0 0.0 0.0 0.0
38 Thailand 0.0 . 0.0 0.0 0.0 0.0
39 Indonesia 0.0 0.0 . 0.0 0.0 0.0
40 Argentina . . 0.0 0.0 0.0 0.0
41 Belgium . . 0.0 33.3 14.6 10.4
42 Philippines 0.0 5.6 0.0 . 0.0 3.6
43 Zimbabwe 0.0 . 0.0 0.0 . 0.0
44 Bangladesh 0.0 0.0 . 0.0 0.0 0.0
45 Hungary 0.0 0.0 . 0.0 0.0 0.0
46 Bulgaria . . 0.0 0.0 0.0 0.0
47 Austria . . 0.0 0.0 . 0.0
48 Taiwan . . 0.0 12.5 0.0 1.8
49 Tunisia . . . 0.0 0.0 0.0
50 Croatia . . . . 14.8 14.8
51 Pakistan 0.0 . . . 0.0 0.0
52 Republic of Serbia . . . 0.0 0.0 0.0

Share of publications among 10% most cited in field, fractionalized (%)


Bar chart of publication_year

Field normalized citation rate (cf), fractionalized

Obs Country 1990-1994 1995-1999 2000-2004 2005-2009 2010-2014 All years
1 All countries 1.07 1.24 0.90 0.82 0.62 0.83
2 United States 1.14 1.30 0.95 0.80 0.69 0.94
3 Spain 0.79 1.90 1.26 1.23 0.82 1.12
4 Australia 0.99 0.71 0.63 0.84 0.92 0.81
5 China 0.05 0.05 0.75 0.66 0.40 0.45
6 Canada 1.56 1.36 0.94 0.83 0.72 1.01
7 United Kingdom 0.77 1.43 0.89 1.07 0.73 0.99
8 Germany 2.34 2.12 0.94 0.80 0.55 1.03
9 Sweden 0.74 0.84 0.66 0.81 0.61 0.74
10 Finland 1.97 0.75 0.91 0.95 0.70 0.86
11 Korea, Republic of . 1.14 0.70 0.51 0.35 0.61
12 France . 1.45 1.34 1.08 1.19 1.23
13 Italy 0.58 1.17 1.07 0.93 0.76 0.90
14 South Africa 0.81 0.44 1.54 0.57 0.61 0.68
15 Japan 0.08 0.56 1.08 0.33 0.51 0.62
16 India 0.13 0.25 0.51 0.40 0.62 0.48
17 Portugal . . 0.82 1.24 0.68 0.87
18 Mexico . 1.12 0.87 0.66 0.58 0.68
19 New Zealand 0.50 2.87 1.00 0.55 0.42 0.83
20 Greece 0.58 1.93 2.38 0.52 0.60 0.96
21 Russian Federation . 0.19 0.44 0.17 0.45 0.37
22 Czech Republic 0.57 0.40 0.51 0.35 0.72 0.63
23 Brazil . 0.53 0.25 0.25 0.36 0.33
24 Poland . 0.23 0.88 0.25 0.40 0.37
25 Iran, Islamic Republic of . . . 0.73 0.51 0.53
26 Denmark 1.78 1.12 0.76 0.59 0.77 0.90
27 Switzerland 1.19 . 2.59 0.87 0.64 1.35
28 Morocco . . 0.63 0.71 0.43 0.54
29 Turkey . . 0.52 0.54 0.60 0.57
30 Netherlands 0.83 1.34 0.35 0.31 0.00 0.81
31 Romania . 1.62 1.04 0.94 0.35 0.55
32 Viet Nam 0.40 0.40 0.42 0.20 0.53 0.36
33 Malaysia 0.30 0.32 0.66 0.22 0.88 0.57
34 Norway 0.63 2.34 0.24 0.45 0.32 0.89
35 Chile . . . 0.11 0.99 0.72
36 Ireland . 1.37 0.27 . . 1.24
37 Slovak Republic . 0.02 0.31 0.47 0.44 0.34
38 Thailand 0.84 . 0.18 0.08 0.29 0.34
39 Indonesia 1.36 0.55 . 0.24 0.55 0.56
40 Argentina . . 0.13 0.99 0.52 0.58
41 Belgium . . 0.85 2.05 1.06 1.05
42 Philippines 0.30 0.84 0.53 . 0.41 0.69
43 Zimbabwe 0.27 . 0.28 0.32 . 0.31
44 Bangladesh 0.14 0.12 . 0.04 0.77 0.43
45 Hungary 0.00 0.20 . 0.53 0.49 0.39
46 Bulgaria . . 0.84 0.29 0.00 0.40
47 Austria . . 0.49 0.73 . 0.71
48 Taiwan . . 1.59 0.66 0.34 0.65
49 Tunisia . . . 1.34 0.51 0.61
50 Croatia . . . . 0.72 0.72
51 Pakistan 0.15 . . . 0.22 0.21
52 Republic of Serbia . . . 0.09 0.51 0.42

Field normalized citation rate (cf), fractionalized


Bar chart of publication_year