Lev2: JOURNAL OF STRUCTURAL GEOLOGY//TECTONOPHYSICS//BULLETIN DE LA SOCIETE GEOLOGIQUE DE FRANCE - Statistics for Countries

Statistics per Country

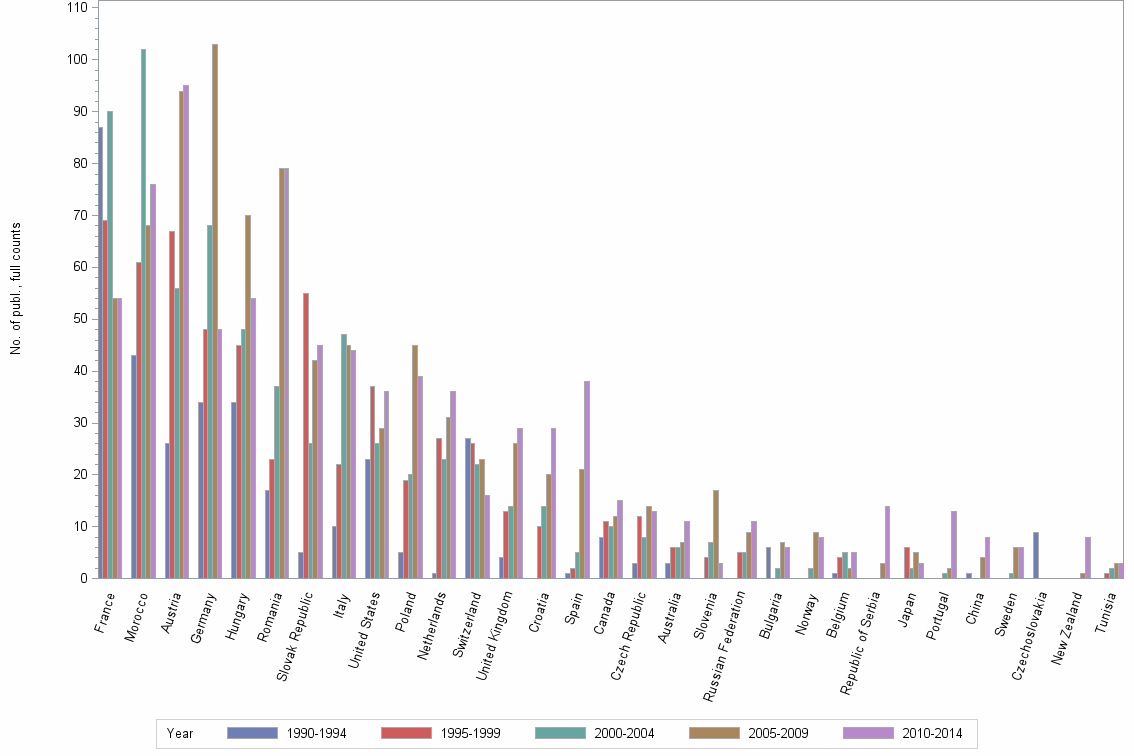
Number of publications, full counts

Obs Country 1990-1994 1995-1999 2000-2004 2005-2009 2010-2014 All years
1 All countries 265 367 400 482 479 1993
2 France 87 69 90 54 54 354
3 Morocco 43 61 102 68 76 350
4 Austria 26 67 56 94 95 338
5 Germany 34 48 68 103 48 301
6 Hungary 34 45 48 70 54 251
7 Romania 17 23 37 79 79 235
8 Slovak Republic 5 55 26 42 45 173
9 Italy 10 22 47 45 44 168
10 United States 23 37 26 29 36 151
11 Poland 5 19 20 45 39 128
12 Netherlands 1 27 23 31 36 118
13 Switzerland 27 26 22 23 16 114
14 United Kingdom 4 13 14 26 29 86
15 Croatia . 10 14 20 29 73
16 Spain 1 2 5 21 38 67
17 Canada 8 11 10 12 15 56
18 Czech Republic 3 12 8 14 13 50
19 Australia 3 6 6 7 11 33
20 Slovenia . 4 7 17 3 31
21 Russian Federation . 5 5 9 11 30
22 Bulgaria 6 . 2 7 6 21
23 Norway . . 2 9 8 19
24 Belgium 1 4 5 2 5 17
25 Republic of Serbia . . . 3 14 17
26 Japan . 6 2 5 3 16
27 Portugal . . 1 2 13 16
28 China 1 . . 4 8 13
29 Sweden . . 1 6 6 13
30 Czechoslovakia 9 . . . . 9
31 New Zealand . . . 1 8 9
32 Tunisia . 1 2 3 3 9
33 Algeria 1 1 6 . . 8
34 Denmark . . 3 4 1 8
35 Ukraine . 3 2 3 . 8
36 South Africa . . 5 . 2 7
37 Egypt . 1 . 1 4 6
38 Ireland . . . 2 3 5
39 Mexico 1 . 1 2 1 5
40 Bosnia and Herzegovina . . 1 3 . 4
41 Finland . . 1 1 2 4
42 Israel 1 1 1 . 1 4
43 Mauritania . . 1 1 2 4
44 Brazil 1 . 1 . 1 3
45 Greece 1 1 . . 1 3
46 Yugoslavia 1 1 1 . . 3
47 Gambia 2 . . . . 2
48 Luxembourg . . . 2 . 2
49 Macedonia . . . . 2 2
50 Moldova . . . . 2 2
51 Senegal . . . . 2 2
52 Turkey . . . 1 1 2

Number of publications, full counts


Bar chart of publication_year

Share of the total number of publications in the field, full counts (%)

Obs Country 1990-1994 1995-1999 2000-2004 2005-2009 2010-2014 All years
1 All countries 100.0 100.0 100.0 100.0 100.0 100.0
2 France 32.8 18.8 22.5 11.2 11.3 17.8
3 Morocco 16.2 16.6 25.5 14.1 15.9 17.6
4 Austria 9.8 18.3 14.0 19.5 19.8 17.0
5 Germany 12.8 13.1 17.0 21.4 10.0 15.1
6 Hungary 12.8 12.3 12.0 14.5 11.3 12.6
7 Romania 6.4 6.3 9.3 16.4 16.5 11.8
8 Slovak Republic 1.9 15.0 6.5 8.7 9.4 8.7
9 Italy 3.8 6.0 11.8 9.3 9.2 8.4
10 United States 8.7 10.1 6.5 6.0 7.5 7.6
11 Poland 1.9 5.2 5.0 9.3 8.1 6.4
12 Netherlands 0.4 7.4 5.8 6.4 7.5 5.9
13 Switzerland 10.2 7.1 5.5 4.8 3.3 5.7
14 United Kingdom 1.5 3.5 3.5 5.4 6.1 4.3
15 Croatia . 2.7 3.5 4.1 6.1 3.7
16 Spain 0.4 0.5 1.3 4.4 7.9 3.4
17 Canada 3.0 3.0 2.5 2.5 3.1 2.8
18 Czech Republic 1.1 3.3 2.0 2.9 2.7 2.5
19 Australia 1.1 1.6 1.5 1.5 2.3 1.7
20 Slovenia . 1.1 1.8 3.5 0.6 1.6
21 Russian Federation . 1.4 1.3 1.9 2.3 1.5
22 Bulgaria 2.3 . 0.5 1.5 1.3 1.1
23 Norway . . 0.5 1.9 1.7 1.0
24 Belgium 0.4 1.1 1.3 0.4 1.0 0.9
25 Republic of Serbia . . . 0.6 2.9 0.9
26 Japan . 1.6 0.5 1.0 0.6 0.8
27 Portugal . . 0.3 0.4 2.7 0.8
28 China 0.4 . . 0.8 1.7 0.7
29 Sweden . . 0.3 1.2 1.3 0.7
30 Czechoslovakia 3.4 . . . . 0.5
31 New Zealand . . . 0.2 1.7 0.5
32 Tunisia . 0.3 0.5 0.6 0.6 0.5
33 Algeria 0.4 0.3 1.5 . . 0.4
34 Denmark . . 0.8 0.8 0.2 0.4
35 Ukraine . 0.8 0.5 0.6 . 0.4
36 South Africa . . 1.3 . 0.4 0.4
37 Egypt . 0.3 . 0.2 0.8 0.3
38 Ireland . . . 0.4 0.6 0.3
39 Mexico 0.4 . 0.3 0.4 0.2 0.3
40 Bosnia and Herzegovina . . 0.3 0.6 . 0.2
41 Finland . . 0.3 0.2 0.4 0.2
42 Israel 0.4 0.3 0.3 . 0.2 0.2
43 Mauritania . . 0.3 0.2 0.4 0.2
44 Brazil 0.4 . 0.3 . 0.2 0.2
45 Greece 0.4 0.3 . . 0.2 0.2
46 Yugoslavia 0.4 0.3 0.3 . . 0.2
47 Gambia 0.8 . . . . 0.1
48 Luxembourg . . . 0.4 . 0.1
49 Macedonia . . . . 0.4 0.1
50 Moldova . . . . 0.4 0.1
51 Senegal . . . . 0.4 0.1
52 Turkey . . . 0.2 0.2 0.1

Share of the total number of publications in the field, full counts (%)


Bar chart of publication_year

Number of publications among 10% most cited in field, full counts

Obs Country 1990-1994 1995-1999 2000-2004 2005-2009 2010-2014 All years
1 All countries 25.4 20.1 26.0 10.7 22.6 104.9
2 France 8.0 0.7 4.4 3.0 2.6 18.7
3 Morocco 1.7 3.4 7.4 3.0 6.7 22.1
4 Austria 2.0 3.6 4.5 2.5 3.0 15.6
5 Germany 5.5 5.2 2.5 3.0 5.0 21.2
6 Hungary 5.5 5.7 2.0 2.0 4.0 19.1
7 Romania 0.0 1.0 2.0 0.0 3.0 6.0
8 Slovak Republic 0.0 1.0 0.0 0.2 2.0 3.2
9 Italy 1.0 0.5 3.0 0.0 0.0 4.5
10 United States 3.3 7.8 3.0 1.0 7.0 22.2
11 Poland 0.0 0.0 0.0 0.0 1.0 1.0
12 Netherlands 1.0 1.0 3.5 2.0 2.0 9.5
13 Switzerland 3.8 3.0 3.0 2.0 2.0 13.8
14 United Kingdom 1.0 1.5 3.0 1.0 3.0 9.5
15 Croatia . 0.0 1.0 0.0 0.0 1.0
16 Spain 1.0 0.0 2.0 1.0 6.1 10.1
17 Canada 1.7 1.0 0.4 0.0 0.5 3.5
18 Czech Republic 0.0 0.0 0.0 0.0 1.0 1.0
19 Australia 0.0 0.0 1.0 0.0 1.0 2.0
20 Slovenia . 0.0 0.0 0.0 0.0 0.0
21 Russian Federation . 0.0 0.0 0.0 0.0 0.0
22 Bulgaria 0.0 . 0.0 0.0 0.0 0.0
23 Norway . . 0.0 0.0 0.0 0.0
24 Belgium 0.0 0.0 2.0 0.0 0.0 2.0
25 Republic of Serbia . . . 0.0 5.0 5.0
26 Japan . 1.0 0.0 0.0 0.0 1.0
27 Portugal . . 0.0 0.0 1.5 1.5
28 China 0.0 . . 0.0 0.0 0.0
29 Sweden . . 0.0 0.0 0.5 0.5
30 Czechoslovakia 2.0 . . . . 2.0
31 New Zealand . . . 0.0 0.0 0.0
32 Tunisia . 0.0 0.0 1.0 0.0 1.0
33 Algeria 0.0 0.0 1.0 . . 1.0
34 Denmark . . 0.0 0.0 0.0 0.0
35 Ukraine . 0.0 0.5 0.0 . 0.5
36 South Africa . . 2.0 . 0.1 2.1
37 Egypt . 0.0 . 0.0 0.0 0.0
38 Ireland . . . 0.0 0.0 0.0
39 Mexico 0.0 . 0.0 0.0 0.0 0.0
40 Bosnia and Herzegovina . . 0.0 0.0 . 0.0
41 Finland . . 0.0 0.0 0.0 0.0
42 Israel 0.0 0.0 0.0 . 1.0 1.0
43 Mauritania . . 0.0 0.0 0.0 0.0
44 Brazil 0.0 . 0.0 . 0.0 0.0
45 Greece 0.0 0.0 . . 0.0 0.0
46 Yugoslavia 0.0 0.0 0.0 . . 0.0
47 Gambia 0.0 . . . . 0.0
48 Luxembourg . . . 0.0 . 0.0
49 Macedonia . . . . 0.0 0.0
50 Moldova . . . . 0.0 0.0
51 Senegal . . . . 0.0 0.0
52 Turkey . . . 0.0 0.0 0.0

Number of publications among 10% most cited in field, full counts


Bar chart of publication_year

Share of publications among 10% most cited in field, fractionalized (%)

Obs Country 1990-1994 1995-1999 2000-2004 2005-2009 2010-2014 All years
1 All countries 9.6 5.5 6.5 2.2 4.7 5.3
2 France 8.8 0.5 3.7 5.8 6.2 5.2
3 Morocco 3.5 3.9 4.5 1.9 7.0 4.3
4 Austria 6.9 3.6 8.3 3.1 1.1 3.8
5 Germany 12.8 14.7 3.1 4.4 11.5 7.9
6 Hungary 17.7 12.8 4.5 1.9 5.5 7.6
7 Romania 0.0 3.9 3.2 0.0 1.7 1.4
8 Slovak Republic 0.0 0.4 0.0 0.9 2.9 1.1
9 Italy 3.6 0.4 7.0 0.0 0.0 2.2
10 United States 18.7 24.7 16.5 4.7 21.7 17.7
11 Poland 0.0 0.0 0.0 0.0 0.9 0.3
12 Netherlands 100.0 4.0 19.6 5.1 7.5 9.2
13 Switzerland 14.1 11.8 16.1 4.5 11.2 12.3
14 United Kingdom 25.0 18.2 15.4 2.2 12.5 12.1
15 Croatia . 0.0 10.1 0.0 0.0 1.9
16 Spain 100.0 0.0 42.9 9.0 12.3 14.5
17 Canada 10.0 2.6 2.0 0.0 1.5 3.2
18 Czech Republic 0.0 0.0 0.0 0.0 4.0 0.8
19 Australia 0.0 0.0 8.3 0.0 5.2 2.7
20 Slovenia . 0.0 0.0 0.0 0.0 0.0
21 Russian Federation . 0.0 0.0 0.0 0.0 0.0
22 Bulgaria 0.0 . 0.0 0.0 0.0 0.0
23 Norway . . 0.0 0.0 0.0 0.0
24 Belgium 0.0 0.0 40.9 0.0 0.0 11.2
25 Republic of Serbia . . . 0.0 16.2 13.7
26 Japan . 3.6 0.0 0.0 0.0 1.5
27 Portugal . . 0.0 0.0 7.2 5.9
28 China 0.0 . . 0.0 0.0 0.0
29 Sweden . . 0.0 0.0 7.5 3.2
30 Czechoslovakia 14.9 . . . . 14.9
31 New Zealand . . . 0.0 0.0 0.0
32 Tunisia . 0.0 0.0 32.4 0.0 7.3
33 Algeria 0.0 0.0 14.4 . . 10.5
34 Denmark . . 0.0 0.0 0.0 0.0
35 Ukraine . 0.0 22.2 0.0 . 3.1
36 South Africa . . 50.0 . 3.4 41.4
37 Egypt . 0.0 . 0.0 0.0 0.0
38 Ireland . . . 0.0 0.0 0.0
39 Mexico 0.0 . 0.0 0.0 0.0 0.0
40 Bosnia and Herzegovina . . 0.0 0.0 . 0.0
41 Finland . . 0.0 0.0 0.0 0.0
42 Israel 0.0 0.0 0.0 . 100.0 11.1
43 Mauritania . . 0.0 0.0 0.0 0.0
44 Brazil 0.0 . 0.0 . 0.0 0.0
45 Greece 0.0 0.0 . . 0.0 0.0
46 Yugoslavia 0.0 0.0 0.0 . . 0.0
47 Gambia 0.0 . . . . 0.0
48 Luxembourg . . . 0.0 . 0.0
49 Macedonia . . . . 0.0 0.0
50 Moldova . . . . 0.0 0.0
51 Senegal . . . . 0.0 0.0
52 Turkey . . . 0.0 0.0 0.0

Share of publications among 10% most cited in field, fractionalized (%)


Bar chart of publication_year

Field normalized citation rate (cf), fractionalized

Obs Country 1990-1994 1995-1999 2000-2004 2005-2009 2010-2014 All years
1 All countries 0.97 0.82 0.76 0.63 0.62 0.73
2 France 0.73 0.45 0.52 0.73 0.74 0.62
3 Morocco 0.62 0.64 0.48 0.51 0.68 0.57
4 Austria 0.94 0.97 0.87 0.73 0.51 0.75
5 Germany 1.53 1.15 0.81 0.67 0.88 0.94
6 Hungary 1.22 1.09 0.78 0.62 0.48 0.80
7 Romania 0.59 0.85 0.80 0.43 0.43 0.53
8 Slovak Republic 0.50 0.37 0.46 0.36 0.56 0.43
9 Italy 0.64 0.61 0.73 0.72 0.49 0.64
10 United States 2.06 2.03 1.12 0.89 1.54 1.56
11 Poland 0.50 0.43 0.40 0.48 0.48 0.46
12 Netherlands 2.93 0.97 1.73 1.09 1.12 1.22
13 Switzerland 1.33 1.17 1.79 1.02 1.02 1.31
14 United Kingdom 1.02 2.23 1.07 1.02 1.03 1.23
15 Croatia . 0.84 0.86 0.43 0.23 0.48
16 Spain 2.82 0.52 1.52 1.11 0.91 1.02
17 Canada 1.04 0.55 0.48 0.32 0.64 0.61
18 Czech Republic 1.50 0.36 0.34 0.42 0.51 0.48
19 Australia 0.06 0.85 0.80 0.33 0.74 0.57
20 Slovenia . 0.69 0.80 0.55 0.45 0.61
21 Russian Federation . 0.18 0.24 0.13 0.24 0.20
22 Bulgaria 0.09 . 0.06 0.31 0.02 0.12
23 Norway . . 1.09 0.94 0.83 0.90
24 Belgium 0.63 0.83 1.51 0.50 0.63 0.92
25 Republic of Serbia . . . 0.64 0.73 0.71
26 Japan . 0.51 0.48 0.54 0.23 0.46
27 Portugal . . 0.00 0.45 0.55 0.49
28 China 0.14 . . 0.61 0.16 0.26
29 Sweden . . 0.18 0.92 0.99 0.89
30 Czechoslovakia 1.00 . . . . 1.00
31 New Zealand . . . 0.74 0.51 0.53
32 Tunisia . 0.58 0.73 0.89 0.19 0.43
33 Algeria 0.05 0.58 0.70 . . 0.54
34 Denmark . . 0.41 1.33 1.74 1.04
35 Ukraine . 0.23 1.00 0.11 . 0.31
36 South Africa . . 2.11 . 1.76 2.04
37 Egypt . 0.10 . 0.89 0.43 0.37
38 Ireland . . . 0.21 0.86 0.49
39 Mexico 0.18 . 0.98 0.71 0.74 0.45
40 Bosnia and Herzegovina . . 0.40 1.18 . 0.86
41 Finland . . 0.45 2.03 1.55 1.20
42 Israel 0.24 0.71 1.71 . 4.93 1.52
43 Mauritania . . 0.52 1.33 1.08 0.89
44 Brazil 0.10 . 0.45 . 0.37 0.32
45 Greece 0.12 0.51 . . 0.80 0.41
46 Yugoslavia 0.14 0.00 0.18 . . 0.11
47 Gambia 0.20 . . . . 0.20
48 Luxembourg . . . 1.00 . 1.00
49 Macedonia . . . . 0.23 0.23
50 Moldova . . . . 0.24 0.24
51 Senegal . . . . 0.09 0.09
52 Turkey . . . 0.15 0.45 0.40

Field normalized citation rate (cf), fractionalized


Bar chart of publication_year