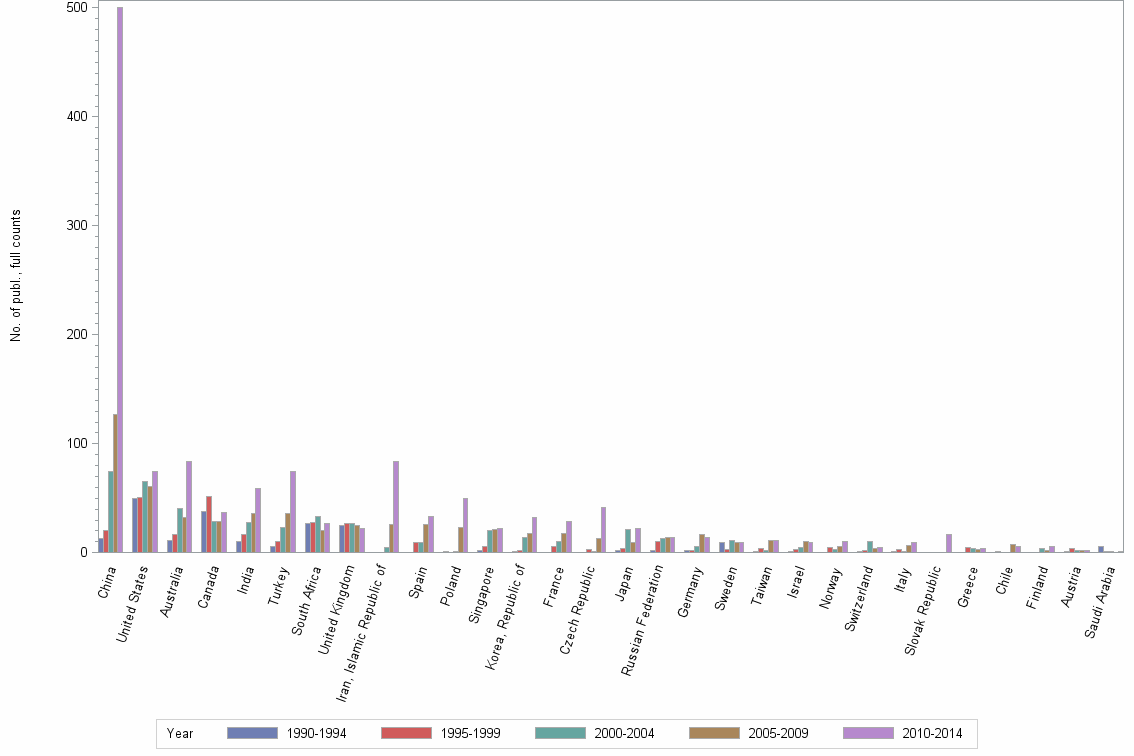
Lev2: INTERNATIONAL JOURNAL OF ROCK MECHANICS AND MINING SCIENCES//ROCK MECHANICS AND ROCK ENGINEERING//ENGINEERING, GEOLOGICAL - Statistics for Countries

Statistics per Country

Number of publications, full counts

Obs Country 1990-1994 1995-1999 2000-2004 2005-2009 2010-2014 All years
1 All countries 193 287 402 543 1123 2548
2 China 13 20 75 127 500 735
3 United States 50 51 65 61 75 302
4 Australia 11 17 41 32 84 185
5 Canada 38 52 29 29 37 185
6 India 10 17 28 36 59 150
7 Turkey 6 10 23 36 75 150
8 South Africa 27 28 33 20 27 135
9 United Kingdom 25 27 27 25 22 126
10 Iran, Islamic Republic of . . 5 26 84 115
11 Spain . 9 9 26 33 77
12 Poland 1 . 1 23 50 75
13 Singapore 2 6 20 21 22 71
14 Korea, Republic of 1 2 14 18 32 67
15 France . 6 10 18 29 63
16 Czech Republic . 3 1 13 42 59
17 Japan 2 4 21 9 22 58
18 Russian Federation 2 10 13 14 14 53
19 Germany 2 2 6 17 14 41
20 Sweden 9 3 11 9 9 41
21 Taiwan 1 4 2 11 11 29
22 Israel 1 3 5 10 9 28
23 Norway . 5 3 6 10 24
24 Switzerland 1 2 10 4 5 22
25 Italy 1 3 1 7 9 21
26 Slovak Republic . . . . 17 17
27 Greece . 5 4 3 4 16
28 Chile 1 . . 8 6 15
29 Finland . . 4 2 6 12
30 Austria 1 4 2 2 2 11
31 Saudi Arabia 6 1 1 . 1 9
32 Brazil . 2 2 1 3 8
33 Egypt 4 1 . 2 1 8
34 Indonesia . . 2 2 4 8
35 Malaysia . . . 1 6 7
36 Republic of Serbia . . . . 7 7
37 Croatia . . . 1 5 6
38 New Zealand 1 2 . 2 1 6
39 Pakistan . . . 2 4 6
40 Portugal . . 1 2 3 6
41 Kazakhstan . 1 3 . 1 5
42 Latvia . . . 2 3 5
43 Ukraine 1 2 2 . . 5
44 Algeria . . 1 2 1 4
45 Romania . . . . 4 4
46 Slovenia . . 2 . 2 4
47 Hungary 1 1 . . 1 3
48 Jordan . . 2 1 . 3
49 Kyrgyz Republic . 2 1 . . 3
50 Mexico . . . . 3 3
51 Netherlands . . 1 2 . 3
52 Nigeria . . . 2 1 3

Number of publications, full counts


Bar chart of publication_year

Share of the total number of publications in the field, full counts (%)

Obs Country 1990-1994 1995-1999 2000-2004 2005-2009 2010-2014 All years
1 All countries 100.0 100.0 100.0 100.0 100.0 100.0
2 China 6.7 7.0 18.7 23.4 44.5 28.8
3 United States 25.9 17.8 16.2 11.2 6.7 11.9
4 Australia 5.7 5.9 10.2 5.9 7.5 7.3
5 Canada 19.7 18.1 7.2 5.3 3.3 7.3
6 India 5.2 5.9 7.0 6.6 5.3 5.9
7 Turkey 3.1 3.5 5.7 6.6 6.7 5.9
8 South Africa 14.0 9.8 8.2 3.7 2.4 5.3
9 United Kingdom 13.0 9.4 6.7 4.6 2.0 4.9
10 Iran, Islamic Republic of . . 1.2 4.8 7.5 4.5
11 Spain . 3.1 2.2 4.8 2.9 3.0
12 Poland 0.5 . 0.2 4.2 4.5 2.9
13 Singapore 1.0 2.1 5.0 3.9 2.0 2.8
14 Korea, Republic of 0.5 0.7 3.5 3.3 2.8 2.6
15 France . 2.1 2.5 3.3 2.6 2.5
16 Czech Republic . 1.0 0.2 2.4 3.7 2.3
17 Japan 1.0 1.4 5.2 1.7 2.0 2.3
18 Russian Federation 1.0 3.5 3.2 2.6 1.2 2.1
19 Germany 1.0 0.7 1.5 3.1 1.2 1.6
20 Sweden 4.7 1.0 2.7 1.7 0.8 1.6
21 Taiwan 0.5 1.4 0.5 2.0 1.0 1.1
22 Israel 0.5 1.0 1.2 1.8 0.8 1.1
23 Norway . 1.7 0.7 1.1 0.9 0.9
24 Switzerland 0.5 0.7 2.5 0.7 0.4 0.9
25 Italy 0.5 1.0 0.2 1.3 0.8 0.8
26 Slovak Republic . . . . 1.5 0.7
27 Greece . 1.7 1.0 0.6 0.4 0.6
28 Chile 0.5 . . 1.5 0.5 0.6
29 Finland . . 1.0 0.4 0.5 0.5
30 Austria 0.5 1.4 0.5 0.4 0.2 0.4
31 Saudi Arabia 3.1 0.3 0.2 . 0.1 0.4
32 Brazil . 0.7 0.5 0.2 0.3 0.3
33 Egypt 2.1 0.3 . 0.4 0.1 0.3
34 Indonesia . . 0.5 0.4 0.4 0.3
35 Malaysia . . . 0.2 0.5 0.3
36 Republic of Serbia . . . . 0.6 0.3
37 Croatia . . . 0.2 0.4 0.2
38 New Zealand 0.5 0.7 . 0.4 0.1 0.2
39 Pakistan . . . 0.4 0.4 0.2
40 Portugal . . 0.2 0.4 0.3 0.2
41 Kazakhstan . 0.3 0.7 . 0.1 0.2
42 Latvia . . . 0.4 0.3 0.2
43 Ukraine 0.5 0.7 0.5 . . 0.2
44 Algeria . . 0.2 0.4 0.1 0.2
45 Romania . . . . 0.4 0.2
46 Slovenia . . 0.5 . 0.2 0.2
47 Hungary 0.5 0.3 . . 0.1 0.1
48 Jordan . . 0.5 0.2 . 0.1
49 Kyrgyz Republic . 0.7 0.2 . . 0.1
50 Mexico . . . . 0.3 0.1
51 Netherlands . . 0.2 0.4 . 0.1
52 Nigeria . . . 0.4 0.1 0.1

Share of the total number of publications in the field, full counts (%)


Bar chart of publication_year

Number of publications among 10% most cited in field, full counts

Obs Country 1990-1994 1995-1999 2000-2004 2005-2009 2010-2014 All years
1 All countries 10.5 24.8 22.0 24.6 68.8 150.8
2 China 1.5 1.5 5.9 7.1 35.2 51.1
3 United States 3.5 7.5 3.6 5.3 5.0 25.0
4 Australia 0.0 2.0 0.0 2.0 8.3 12.3
5 Canada 1.5 5.8 2.0 1.1 3.4 13.8
6 India 0.5 0.0 3.0 4.0 2.0 9.5
7 Turkey 0.0 0.0 0.0 1.0 3.0 4.0
8 South Africa 3.0 0.0 0.5 0.0 1.0 4.5
9 United Kingdom 0.0 2.8 2.6 0.5 2.9 8.8
10 Iran, Islamic Republic of . . 0.0 1.1 10.4 11.5
11 Spain . 0.5 0.0 0.5 1.5 2.5
12 Poland 0.0 . 0.0 0.7 1.0 1.7
13 Singapore 0.0 0.7 0.0 2.4 3.5 6.6
14 Korea, Republic of 0.0 1.0 1.5 0.5 1.0 4.0
15 France . 0.5 0.0 0.0 0.7 1.2
16 Czech Republic . 0.0 0.0 0.0 1.1 1.1
17 Japan 0.0 0.5 1.5 0.0 0.2 2.2
18 Russian Federation 0.0 0.5 0.5 0.0 0.0 1.0
19 Germany 0.0 0.0 0.0 1.0 1.0 2.0
20 Sweden 1.5 1.5 3.1 0.0 0.0 6.1
21 Taiwan 0.0 1.5 0.0 1.0 2.7 5.2
22 Israel 0.5 0.5 2.0 0.7 0.5 4.2
23 Norway . 0.0 0.0 1.0 1.5 2.5
24 Switzerland 0.0 0.0 0.0 1.0 2.3 3.3
25 Italy 0.0 0.0 0.0 0.0 0.0 0.0
26 Slovak Republic . . . . 0.0 0.0
27 Greece . 0.5 0.0 0.0 0.0 0.5
28 Chile 0.0 . . 0.0 0.0 0.0
29 Finland . . 0.0 0.0 0.0 0.0
30 Austria 0.0 0.0 0.0 0.0 0.0 0.0
31 Saudi Arabia 0.0 0.0 0.0 . 0.0 0.0
32 Brazil . 0.0 0.0 0.0 0.0 0.0
33 Egypt 0.0 0.0 . 1.0 0.0 1.0
34 Indonesia . . 0.0 0.3 1.0 1.3
35 Malaysia . . . 0.0 2.0 2.0
36 Republic of Serbia . . . . 0.0 0.0
37 Croatia . . . 0.0 0.0 0.0
38 New Zealand 0.0 0.0 . 0.0 0.0 0.0
39 Pakistan . . . 0.0 0.0 0.0
40 Portugal . . 0.0 0.5 0.0 0.5
41 Kazakhstan . 0.0 0.0 . 0.0 0.0
42 Latvia . . . 0.0 0.0 0.0
43 Ukraine 0.0 0.0 0.0 . . 0.0
44 Algeria . . 0.0 0.0 0.0 0.0
45 Romania . . . . 0.0 0.0
46 Slovenia . . 0.5 . 0.0 0.5
47 Hungary 0.0 0.0 . . 0.0 0.0
48 Jordan . . 0.0 0.0 . 0.0
49 Kyrgyz Republic . 0.0 0.0 . . 0.0
50 Mexico . . . . 0.0 0.0
51 Netherlands . . 0.0 0.0 . 0.0
52 Nigeria . . . 0.0 0.0 0.0

Number of publications among 10% most cited in field, full counts


Bar chart of publication_year

Share of publications among 10% most cited in field, fractionalized (%)

Obs Country 1990-1994 1995-1999 2000-2004 2005-2009 2010-2014 All years
1 All countries 5.4 8.6 5.5 4.5 6.1 5.9
2 China 13.1 7.2 6.9 4.3 6.5 6.3
3 United States 5.9 14.0 4.7 6.4 5.5 7.2
4 Australia 0.0 12.4 0.0 6.6 7.3 5.7
5 Canada 4.3 11.7 8.5 3.1 11.0 8.3
6 India 5.7 0.0 10.7 11.4 3.0 6.5
7 Turkey 0.0 0.0 0.0 2.8 3.0 2.2
8 South Africa 11.3 0.0 1.6 0.0 1.1 2.9
9 United Kingdom 0.0 10.8 7.1 2.8 11.1 6.2
10 Iran, Islamic Republic of . . 0.0 4.9 13.0 10.9
11 Spain . 5.8 0.0 2.1 4.8 3.4
12 Poland 0.0 . 0.0 3.1 2.1 2.4
13 Singapore 0.0 11.1 0.0 12.7 13.0 8.3
14 Korea, Republic of 0.0 60.0 13.0 1.7 3.8 6.0
15 France . 8.3 0.0 0.0 3.5 2.6
16 Czech Republic . 0.0 0.0 0.0 1.8 1.2
17 Japan 0.0 14.3 8.7 0.0 0.2 4.5
18 Russian Federation 0.0 5.9 4.5 0.0 0.0 2.1
19 Germany 0.0 2.1 0.0 7.3 3.8 4.4
20 Sweden 18.6 50.0 25.1 0.0 0.0 13.8
21 Taiwan 0.0 28.6 0.0 7.8 24.2 16.5
22 Israel 50.0 25.0 36.8 4.2 6.7 15.4
23 Norway . 0.0 0.0 18.2 20.9 12.1
24 Switzerland 0.0 0.0 0.0 26.1 42.9 13.1
25 Italy 0.0 0.0 0.0 0.0 0.0 0.0
26 Slovak Republic . . . . 0.0 0.0
27 Greece . 10.0 0.0 0.0 0.0 3.3
28 Chile 0.0 . . 0.0 0.0 0.0
29 Finland . . 0.0 0.0 0.0 0.0
30 Austria 0.0 0.0 0.0 0.0 0.0 0.0
31 Saudi Arabia 0.0 0.0 0.0 . 0.0 0.0
32 Brazil . 0.0 0.0 0.0 0.0 0.0
33 Egypt 0.0 0.0 . 66.7 0.0 21.8
34 Indonesia . . 0.0 13.8 30.8 22.5
35 Malaysia . . . 0.0 48.0 44.4
36 Republic of Serbia . . . . 0.0 0.0
37 Croatia . . . 0.0 0.0 0.0
38 New Zealand 0.0 0.0 . 0.0 0.0 0.0
39 Pakistan . . . 0.0 0.0 0.0
40 Portugal . . 0.0 25.0 0.0 10.5
41 Kazakhstan . 0.0 0.0 . 0.0 0.0
42 Latvia . . . 0.0 0.0 0.0
43 Ukraine 0.0 0.0 0.0 . . 0.0
44 Algeria . . 0.0 0.0 0.0 0.0
45 Romania . . . . 0.0 0.0
46 Slovenia . . 25.0 . 0.0 19.4
47 Hungary 0.0 0.0 . . 0.0 0.0
48 Jordan . . 0.0 0.0 . 0.0
49 Kyrgyz Republic . 0.0 0.0 . . 0.0
50 Mexico . . . . 0.0 0.0
51 Netherlands . . 0.0 0.0 . 0.0
52 Nigeria . . . 0.0 0.0 0.0

Share of publications among 10% most cited in field, fractionalized (%)


Bar chart of publication_year

Field normalized citation rate (cf), fractionalized

Obs Country 1990-1994 1995-1999 2000-2004 2005-2009 2010-2014 All years
1 All countries 0.74 0.84 0.73 0.69 0.76 0.75
2 China 0.84 0.68 0.69 0.66 0.81 0.77
3 United States 0.66 1.05 0.81 0.84 0.65 0.80
4 Australia 0.60 1.24 0.61 0.80 0.84 0.82
5 Canada 0.69 1.23 0.80 0.75 1.03 0.95
6 India 1.02 0.47 0.97 0.79 0.76 0.79
7 Turkey 0.39 0.27 0.59 0.81 0.63 0.64
8 South Africa 1.39 0.25 0.47 0.26 0.33 0.56
9 United Kingdom 0.40 0.64 0.59 0.70 1.00 0.63
10 Iran, Islamic Republic of . . 0.36 0.86 1.09 1.02
11 Spain . 0.66 0.55 0.70 0.57 0.62
12 Poland 0.35 . 0.96 0.36 0.41 0.40
13 Singapore 0.17 1.06 0.59 1.23 1.41 1.02
14 Korea, Republic of 0.38 3.68 1.22 0.81 0.78 0.92
15 France . 0.77 0.54 0.72 0.70 0.69
16 Czech Republic . 0.39 1.17 0.54 0.50 0.52
17 Japan 0.09 0.79 0.81 1.11 0.43 0.67
18 Russian Federation 0.00 0.62 0.46 0.14 0.34 0.35
19 Germany 0.71 0.64 0.40 0.65 0.74 0.63
20 Sweden 1.49 3.38 2.04 0.54 0.26 1.26
21 Taiwan 0.64 1.38 0.38 0.84 1.20 1.02
22 Israel 2.17 1.39 2.52 0.91 1.05 1.38
23 Norway . 0.69 0.91 1.05 1.14 0.97
24 Switzerland 1.07 0.96 0.72 1.95 2.40 1.31
25 Italy 0.44 0.48 0.87 0.61 0.28 0.48
26 Slovak Republic . . . . 0.54 0.54
27 Greece . 1.17 0.57 0.32 0.72 0.76
28 Chile 0.95 . . 0.36 0.15 0.28
29 Finland . . 0.30 0.25 0.26 0.27
30 Austria 0.00 0.39 0.17 0.19 0.35 0.27
31 Saudi Arabia 0.32 0.00 0.05 . 0.00 0.23
32 Brazil . 0.90 0.17 0.00 0.07 0.26
33 Egypt 0.48 0.04 . 2.71 2.19 1.49
34 Indonesia . . 0.14 0.81 1.74 1.30
35 Malaysia . . . 0.23 4.01 3.73
36 Republic of Serbia . . . . 0.67 0.67
37 Croatia . . . 0.19 0.43 0.38
38 New Zealand 1.16 0.41 . 0.05 1.37 0.59
39 Pakistan . . . 0.35 0.43 0.40
40 Portugal . . 0.97 1.64 0.88 1.22
41 Kazakhstan . 0.00 0.24 . 0.25 0.19
42 Latvia . . . 0.00 0.00 0.00
43 Ukraine 0.13 0.11 0.24 . . 0.17
44 Algeria . . 0.10 0.06 0.00 0.06
45 Romania . . . . 0.17 0.17
46 Slovenia . . 1.24 . 0.00 0.96
47 Hungary 0.16 0.95 . . 0.10 0.21
48 Jordan . . 0.11 0.06 . 0.09
49 Kyrgyz Republic . 0.00 0.38 . . 0.19
50 Mexico . . . . 0.29 0.29
51 Netherlands . . 0.32 0.75 . 0.57
52 Nigeria . . . 0.48 0.26 0.44

Field normalized citation rate (cf), fractionalized


Bar chart of publication_year