Lev2: RADON//NATURAL RADIOACTIVITY//INDOOR RADON - Statistics for Countries |
Statistics per Country |
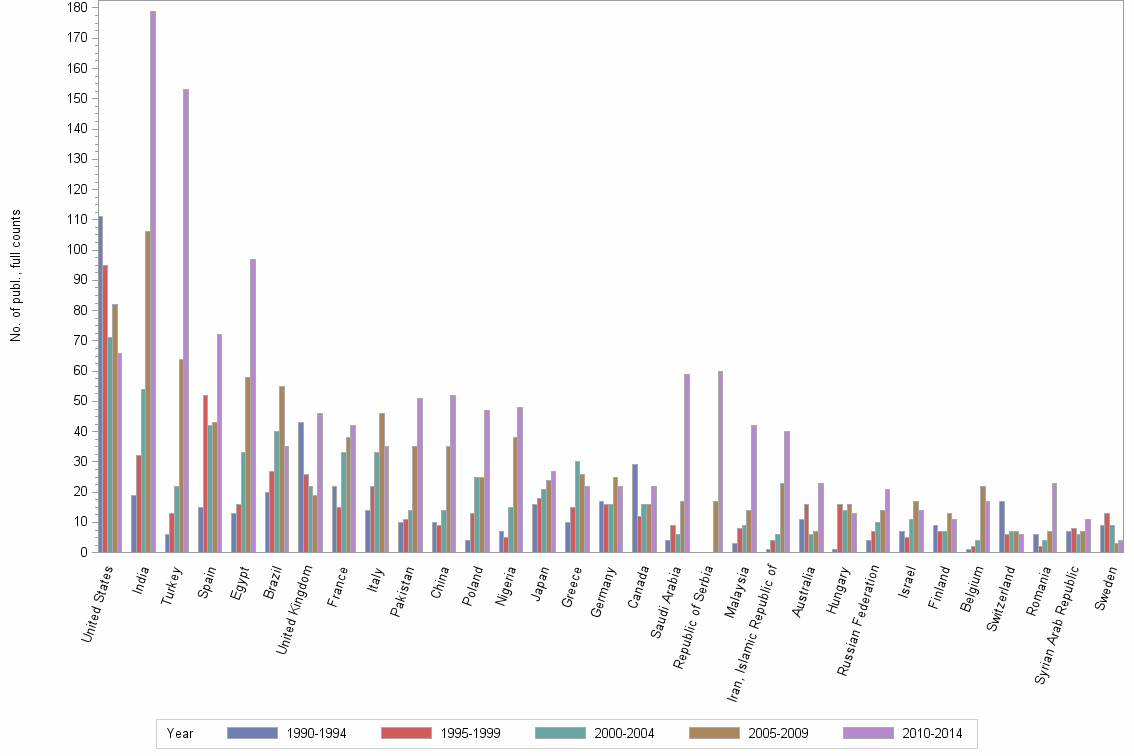
Number of publications, full counts |
| Obs | Country | 1990-1994 | 1995-1999 | 2000-2004 | 2005-2009 | 2010-2014 | All years |
|---|---|---|---|---|---|---|---|
| 1 | All countries | 467 | 575 | 628 | 936 | 1391 | 3997 |
| 2 | United States | 111 | 95 | 71 | 82 | 66 | 425 |
| 3 | India | 19 | 32 | 54 | 106 | 179 | 390 |
| 4 | Turkey | 6 | 13 | 22 | 64 | 153 | 258 |
| 5 | Spain | 15 | 52 | 42 | 43 | 72 | 224 |
| 6 | Egypt | 13 | 16 | 33 | 58 | 97 | 217 |
| 7 | Brazil | 20 | 27 | 40 | 55 | 35 | 177 |
| 8 | United Kingdom | 43 | 26 | 22 | 19 | 46 | 156 |
| 9 | France | 22 | 15 | 33 | 38 | 42 | 150 |
| 10 | Italy | 14 | 22 | 33 | 46 | 35 | 150 |
| 11 | Pakistan | 10 | 11 | 14 | 35 | 51 | 121 |
| 12 | China | 10 | 9 | 14 | 35 | 52 | 120 |
| 13 | Poland | 4 | 13 | 25 | 25 | 47 | 114 |
| 14 | Nigeria | 7 | 5 | 15 | 38 | 48 | 113 |
| 15 | Japan | 16 | 18 | 21 | 24 | 27 | 106 |
| 16 | Greece | 10 | 15 | 30 | 26 | 22 | 103 |
| 17 | Germany | 17 | 16 | 16 | 25 | 22 | 96 |
| 18 | Canada | 29 | 12 | 16 | 16 | 22 | 95 |
| 19 | Saudi Arabia | 4 | 9 | 6 | 17 | 59 | 95 |
| 20 | Republic of Serbia | . | . | . | 17 | 60 | 77 |
| 21 | Malaysia | 3 | 8 | 9 | 14 | 42 | 76 |
| 22 | Iran, Islamic Republic of | 1 | 4 | 6 | 23 | 40 | 74 |
| 23 | Australia | 11 | 16 | 6 | 7 | 23 | 63 |
| 24 | Hungary | 1 | 16 | 14 | 16 | 13 | 60 |
| 25 | Russian Federation | 4 | 7 | 10 | 14 | 21 | 56 |
| 26 | Israel | 7 | 5 | 11 | 17 | 14 | 54 |
| 27 | Finland | 9 | 7 | 7 | 13 | 11 | 47 |
| 28 | Belgium | 1 | 2 | 4 | 22 | 17 | 46 |
| 29 | Switzerland | 17 | 6 | 7 | 7 | 6 | 43 |
| 30 | Romania | 6 | 2 | 4 | 7 | 23 | 42 |
| 31 | Syrian Arab Republic | 7 | 8 | 6 | 7 | 11 | 39 |
| 32 | Cyprus | . | . | 6 | 10 | 22 | 38 |
| 33 | Sweden | 9 | 13 | 9 | 3 | 4 | 38 |
| 34 | Mexico | 3 | 3 | 6 | 11 | 14 | 37 |
| 35 | Bangladesh | 2 | 10 | 8 | 2 | 11 | 33 |
| 36 | Taiwan | 6 | 7 | 3 | 8 | 9 | 33 |
| 37 | Czech Republic | . | 4 | 4 | 11 | 12 | 31 |
| 38 | Netherlands | 5 | 5 | 6 | 8 | 6 | 30 |
| 39 | Austria | 6 | 4 | 2 | 10 | 7 | 29 |
| 40 | Hong Kong | 12 | 16 | . | . | . | 28 |
| 41 | Jordan | . | 2 | 5 | 11 | 10 | 28 |
| 42 | Slovenia | . | 4 | 5 | . | 18 | 27 |
| 43 | Korea, Republic of | 1 | 2 | 6 | 6 | 9 | 24 |
| 44 | Sudan | 1 | 6 | 5 | 3 | 8 | 23 |
| 45 | Croatia | . | 7 | 2 | 6 | 7 | 22 |
| 46 | Yugoslavia | 7 | 10 | 1 | 1 | . | 19 |
| 47 | Ghana | . | . | 1 | 1 | 14 | 16 |
| 48 | Norway | 2 | 3 | 2 | 2 | 7 | 16 |
| 49 | Portugal | 1 | 1 | 1 | 1 | 12 | 16 |
| 50 | Algeria | 1 | 5 | 4 | 2 | 3 | 15 |
| 51 | Tunisia | . | . | 1 | 8 | 6 | 15 |
Number of publications, full counts |