Lev2: MAGNETOTELLURICS//GEOPHYSICS//JOURNAL OF APPLIED GEOPHYSICS - Statistics for Countries

Statistics per Country

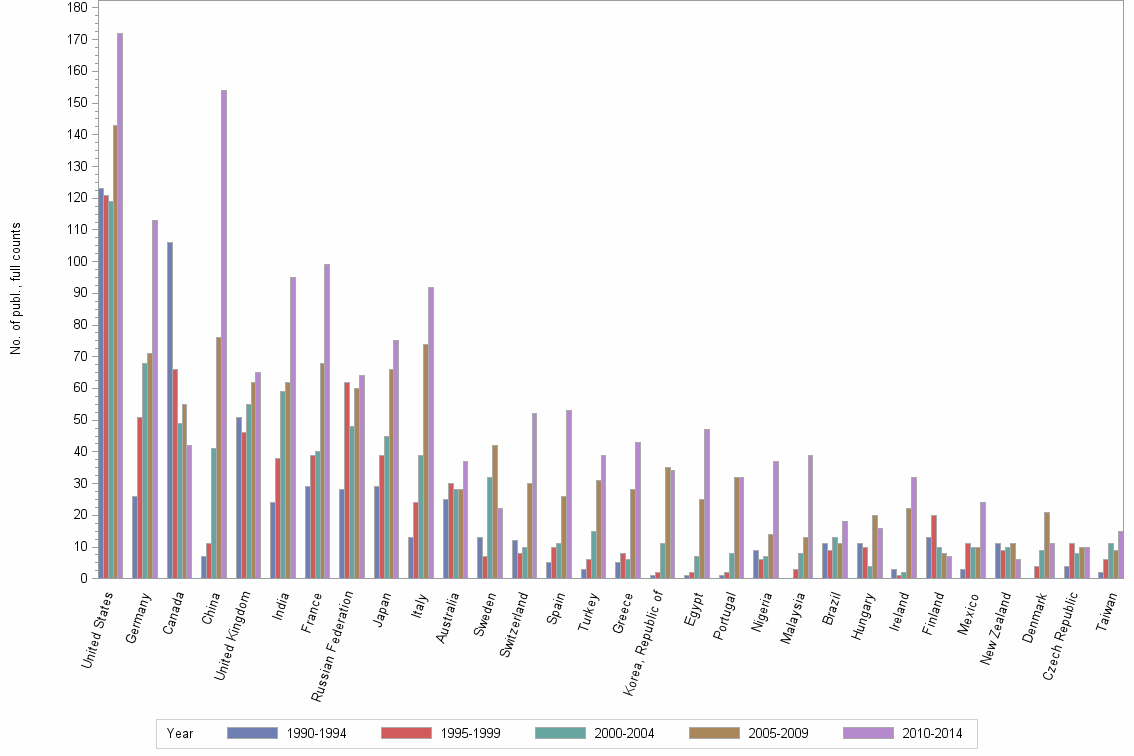
Number of publications, full counts

Obs Country 1990-1994 1995-1999 2000-2004 2005-2009 2010-2014 All years
1 All countries 582 581 676 958 1303 4100
2 United States 123 121 119 143 172 678
3 Germany 26 51 68 71 113 329
4 Canada 106 66 49 55 42 318
5 China 7 11 41 76 154 289
6 United Kingdom 51 46 55 62 65 279
7 India 24 38 59 62 95 278
8 France 29 39 40 68 99 275
9 Russian Federation 28 62 48 60 64 262
10 Japan 29 39 45 66 75 254
11 Italy 13 24 39 74 92 242
12 Australia 25 30 28 28 37 148
13 Sweden 13 7 32 42 22 116
14 Switzerland 12 8 10 30 52 112
15 Spain 5 10 11 26 53 105
16 Turkey 3 6 15 31 39 94
17 Greece 5 8 6 28 43 90
18 Korea, Republic of 1 2 11 35 34 83
19 Egypt 1 2 7 25 47 82
20 Portugal 1 2 8 32 32 75
21 Nigeria 9 6 7 14 37 73
22 Malaysia . 3 8 13 39 63
23 Brazil 11 9 13 11 18 62
24 Hungary 11 10 4 20 16 61
25 Ireland 3 1 2 22 32 60
26 Finland 13 20 10 8 7 58
27 Mexico 3 11 10 10 24 58
28 New Zealand 11 9 10 11 6 47
29 Denmark . 4 9 21 11 45
30 Czech Republic 4 11 8 10 10 43
31 Taiwan 2 6 11 9 15 43
32 Argentina 2 4 11 7 18 42
33 Poland . 4 3 14 20 41
34 USSR 39 . . . . 39
35 Belgium 1 3 5 9 17 35
36 Norway 3 4 2 5 17 31
37 Saudi Arabia 2 1 . 5 22 30
38 Netherlands 8 3 4 5 9 29
39 Ukraine . 6 4 5 10 25
40 Thailand . . 3 7 14 24
41 Iran, Islamic Republic of . . . 4 16 20
42 Austria 1 . 2 8 4 15
43 South Africa 1 . 1 5 8 15
44 Czechoslovakia 13 . . . . 13
45 Israel 4 2 . 3 3 12
46 Senegal 1 7 4 . . 12
47 Indonesia . 3 1 2 5 11
48 Jordan . . 3 7 1 11
49 Pakistan . . . . 11 11
50 Slovak Republic 1 2 . 2 6 11
51 Syrian Arab Republic . . 1 5 5 11

Number of publications, full counts


Bar chart of publication_year

Share of the total number of publications in the field, full counts (%)

Obs Country 1990-1994 1995-1999 2000-2004 2005-2009 2010-2014 All years
1 All countries 100.0 100.0 100.0 100.0 100.0 100.0
2 United States 21.1 20.8 17.6 14.9 13.2 16.5
3 Germany 4.5 8.8 10.1 7.4 8.7 8.0
4 Canada 18.2 11.4 7.2 5.7 3.2 7.8
5 China 1.2 1.9 6.1 7.9 11.8 7.0
6 United Kingdom 8.8 7.9 8.1 6.5 5.0 6.8
7 India 4.1 6.5 8.7 6.5 7.3 6.8
8 France 5.0 6.7 5.9 7.1 7.6 6.7
9 Russian Federation 4.8 10.7 7.1 6.3 4.9 6.4
10 Japan 5.0 6.7 6.7 6.9 5.8 6.2
11 Italy 2.2 4.1 5.8 7.7 7.1 5.9
12 Australia 4.3 5.2 4.1 2.9 2.8 3.6
13 Sweden 2.2 1.2 4.7 4.4 1.7 2.8
14 Switzerland 2.1 1.4 1.5 3.1 4.0 2.7
15 Spain 0.9 1.7 1.6 2.7 4.1 2.6
16 Turkey 0.5 1.0 2.2 3.2 3.0 2.3
17 Greece 0.9 1.4 0.9 2.9 3.3 2.2
18 Korea, Republic of 0.2 0.3 1.6 3.7 2.6 2.0
19 Egypt 0.2 0.3 1.0 2.6 3.6 2.0
20 Portugal 0.2 0.3 1.2 3.3 2.5 1.8
21 Nigeria 1.5 1.0 1.0 1.5 2.8 1.8
22 Malaysia . 0.5 1.2 1.4 3.0 1.5
23 Brazil 1.9 1.5 1.9 1.1 1.4 1.5
24 Hungary 1.9 1.7 0.6 2.1 1.2 1.5
25 Ireland 0.5 0.2 0.3 2.3 2.5 1.5
26 Finland 2.2 3.4 1.5 0.8 0.5 1.4
27 Mexico 0.5 1.9 1.5 1.0 1.8 1.4
28 New Zealand 1.9 1.5 1.5 1.1 0.5 1.1
29 Denmark . 0.7 1.3 2.2 0.8 1.1
30 Czech Republic 0.7 1.9 1.2 1.0 0.8 1.0
31 Taiwan 0.3 1.0 1.6 0.9 1.2 1.0
32 Argentina 0.3 0.7 1.6 0.7 1.4 1.0
33 Poland . 0.7 0.4 1.5 1.5 1.0
34 USSR 6.7 . . . . 1.0
35 Belgium 0.2 0.5 0.7 0.9 1.3 0.9
36 Norway 0.5 0.7 0.3 0.5 1.3 0.8
37 Saudi Arabia 0.3 0.2 . 0.5 1.7 0.7
38 Netherlands 1.4 0.5 0.6 0.5 0.7 0.7
39 Ukraine . 1.0 0.6 0.5 0.8 0.6
40 Thailand . . 0.4 0.7 1.1 0.6
41 Iran, Islamic Republic of . . . 0.4 1.2 0.5
42 Austria 0.2 . 0.3 0.8 0.3 0.4
43 South Africa 0.2 . 0.1 0.5 0.6 0.4
44 Czechoslovakia 2.2 . . . . 0.3
45 Israel 0.7 0.3 . 0.3 0.2 0.3
46 Senegal 0.2 1.2 0.6 . . 0.3
47 Indonesia . 0.5 0.1 0.2 0.4 0.3
48 Jordan . . 0.4 0.7 0.1 0.3
49 Pakistan . . . . 0.8 0.3
50 Slovak Republic 0.2 0.3 . 0.2 0.5 0.3
51 Syrian Arab Republic . . 0.1 0.5 0.4 0.3

Share of the total number of publications in the field, full counts (%)


Bar chart of publication_year

Number of publications among 10% most cited in field, full counts

Obs Country 1990-1994 1995-1999 2000-2004 2005-2009 2010-2014 All years
1 All countries 41.4 32.1 57.6 66.9 69.8 267.8
2 United States 22.7 15.0 17.9 19.4 30.5 105.5
3 Germany 2.0 2.0 4.8 8.3 19.7 36.9
4 Canada 9.8 4.5 6.3 4.5 3.2 28.2
5 China 0.0 0.0 0.0 2.0 1.2 3.2
6 United Kingdom 6.4 8.0 12.7 7.8 11.5 46.4
7 India 0.0 0.5 1.5 2.0 0.2 4.2
8 France 0.0 1.5 3.2 8.2 11.9 24.9
9 Russian Federation 0.0 0.5 0.0 0.0 0.0 0.5
10 Japan 3.0 1.5 2.5 7.6 2.4 17.0
11 Italy 0.0 1.5 1.5 8.1 3.2 14.3
12 Australia 0.0 0.5 3.0 0.5 3.3 7.3
13 Sweden 0.0 1.0 5.0 2.5 1.2 9.7
14 Switzerland 1.0 0.5 3.0 2.8 7.4 14.7
15 Spain 0.0 0.0 0.0 3.5 1.9 5.4
16 Turkey 0.0 0.0 0.0 1.8 0.9 2.7
17 Greece 0.5 0.0 0.5 3.8 3.1 7.9
18 Korea, Republic of 0.0 0.0 1.5 1.0 2.9 5.4
19 Egypt 0.0 0.1 0.0 0.0 0.5 0.6
20 Portugal 0.5 0.0 0.5 1.5 0.0 2.5
21 Nigeria 0.0 0.0 0.5 1.0 1.0 2.5
22 Malaysia . 3.0 2.4 0.5 4.2 10.1
23 Brazil 0.1 0.0 0.1 0.3 0.0 0.5
24 Hungary 0.0 0.0 0.0 0.0 0.0 0.0
25 Ireland 0.0 0.0 1.0 0.5 1.8 3.3
26 Finland 0.0 0.5 0.0 0.0 0.0 0.5
27 Mexico 0.0 0.0 2.0 0.0 0.0 2.0
28 New Zealand 0.0 0.0 1.5 2.3 0.0 3.8
29 Denmark . 1.0 1.0 3.5 0.1 5.6
30 Czech Republic 0.0 0.0 0.0 0.0 0.0 0.0
31 Taiwan 0.0 0.0 0.0 0.0 0.0 0.0
32 Argentina 0.0 0.0 1.0 0.0 0.0 1.0
33 Poland . 0.0 0.0 0.0 0.0 0.0
34 USSR 0.0 . . . . 0.0
35 Belgium 0.0 0.0 0.0 3.0 1.6 4.6
36 Norway 0.0 0.0 1.3 0.0 1.5 2.8
37 Saudi Arabia 0.0 0.0 . 0.0 0.0 0.0
38 Netherlands 1.5 0.0 0.0 0.0 1.0 2.5
39 Ukraine . 0.0 0.0 0.0 0.0 0.0
40 Thailand . . 0.5 1.4 1.0 2.9
41 Iran, Islamic Republic of . . . 0.0 0.0 0.0
42 Austria 0.0 . 0.0 2.0 0.7 2.7
43 South Africa 0.0 . 1.0 0.5 0.0 1.5
44 Czechoslovakia 0.0 . . . . 0.0
45 Israel 0.0 0.5 . 0.5 0.0 1.0
46 Senegal 0.0 1.0 0.0 . . 1.0
47 Indonesia . 0.0 0.0 0.0 0.0 0.0
48 Jordan . . 0.0 0.3 0.0 0.3
49 Pakistan . . . . 0.0 0.0
50 Slovak Republic 0.0 0.0 . 0.0 0.0 0.0
51 Syrian Arab Republic . . 0.0 0.0 0.0 0.0

Number of publications among 10% most cited in field, full counts


Bar chart of publication_year

Share of publications among 10% most cited in field, fractionalized (%)

Obs Country 1990-1994 1995-1999 2000-2004 2005-2009 2010-2014 All years
1 All countries 7.1 5.5 8.5 7.0 5.4 6.5
2 United States 18.3 13.2 15.3 14.8 16.3 15.7
3 Germany 6.8 4.2 4.7 10.3 16.6 9.5
4 Canada 9.5 8.2 12.7 9.8 7.5 9.6
5 China 0.0 0.0 0.0 1.4 0.5 0.7
6 United Kingdom 10.7 13.8 23.1 7.8 15.7 13.9
7 India 0.0 1.5 2.7 3.6 0.1 1.6
8 France 0.0 1.1 10.0 12.5 9.2 7.8
9 Russian Federation 0.0 0.5 0.0 0.0 0.0 0.1
10 Japan 11.0 3.6 5.6 9.1 1.7 5.9
11 Italy 0.0 4.2 4.2 9.1 2.8 5.0
12 Australia 0.0 0.3 8.5 0.2 7.8 3.4
13 Sweden 0.0 8.7 14.6 4.4 4.8 7.1
14 Switzerland 9.2 2.0 31.3 9.7 13.8 13.0
15 Spain 0.0 0.0 0.0 9.6 2.6 3.6
16 Turkey 0.0 0.0 0.0 5.7 2.9 3.1
17 Greece 6.3 0.0 10.3 15.6 5.9 9.2
18 Korea, Republic of 0.0 0.0 12.5 3.2 4.7 5.1
19 Egypt 0.0 8.4 0.0 0.0 1.7 1.2
20 Portugal 50.0 0.0 7.3 3.8 0.0 3.7
21 Nigeria 0.0 0.0 4.5 7.7 3.2 3.6
22 Malaysia . 100.0 17.6 1.5 6.7 9.9
23 Brazil 0.7 0.0 1.2 3.1 0.0 0.9
24 Hungary 0.0 0.0 0.0 0.0 0.0 0.0
25 Ireland 0.0 0.0 50.0 0.6 5.1 4.3
26 Finland 0.0 3.1 0.0 0.0 0.0 1.2
27 Mexico 0.0 0.0 13.2 0.0 0.0 2.1
28 New Zealand 0.0 0.0 13.8 20.7 0.0 7.2
29 Denmark . 28.6 12.8 22.9 2.4 16.3
30 Czech Republic 0.0 0.0 0.0 0.0 0.0 0.0
31 Taiwan 0.0 0.0 0.0 0.0 0.0 0.0
32 Argentina 0.0 0.0 8.8 0.0 0.0 2.3
33 Poland . 0.0 0.0 0.0 0.0 0.0
34 USSR 0.0 . . . . 0.0
35 Belgium 0.0 0.0 0.0 16.2 7.3 7.0
36 Norway 0.0 0.0 66.7 0.0 4.7 5.5
37 Saudi Arabia 0.0 0.0 . 0.0 0.0 0.0
38 Netherlands 25.7 0.0 0.0 0.0 8.0 9.7
39 Ukraine . 0.0 0.0 0.0 0.0 0.0
40 Thailand . . 12.5 18.6 8.8 11.3
41 Iran, Islamic Republic of . . . 0.0 0.0 0.0
42 Austria 0.0 . 0.0 18.8 11.6 13.2
43 South Africa 0.0 . 100.0 7.2 0.0 14.1
44 Czechoslovakia 0.0 . . . . 0.0
45 Israel 0.0 10.0 . 21.4 0.0 7.3
46 Senegal 0.0 16.5 0.0 . . 10.0
47 Indonesia . 0.0 0.0 0.0 0.0 0.0
48 Jordan . . 0.0 4.9 0.0 3.1
49 Pakistan . . . . 0.0 0.0
50 Slovak Republic 0.0 0.0 . 0.0 0.0 0.0
51 Syrian Arab Republic . . 0.0 0.0 0.0 0.0

Share of publications among 10% most cited in field, fractionalized (%)


Bar chart of publication_year

Field normalized citation rate (cf), fractionalized

Obs Country 1990-1994 1995-1999 2000-2004 2005-2009 2010-2014 All years
1 All countries 0.78 0.67 0.90 0.81 0.70 0.77
2 United States 1.60 1.12 1.49 1.32 1.35 1.38
3 Germany 0.89 0.77 0.88 1.08 1.22 1.00
4 Canada 0.77 0.82 1.02 0.86 0.89 0.85
5 China 0.21 0.13 0.27 0.41 0.43 0.39
6 United Kingdom 1.73 1.52 1.92 0.94 1.35 1.47
7 India 0.15 0.29 0.36 0.53 0.39 0.38
8 France 0.35 0.49 1.09 1.34 1.03 0.95
9 Russian Federation 0.11 0.15 0.23 0.12 0.10 0.14
10 Japan 0.90 0.53 0.74 0.95 0.73 0.78
11 Italy 0.45 0.53 0.69 0.98 0.77 0.78
12 Australia 0.32 0.37 0.91 0.46 0.85 0.58
13 Sweden 0.21 0.81 1.18 0.95 0.74 0.87
14 Switzerland 0.81 0.33 1.75 1.03 1.30 1.13
15 Spain 0.37 0.34 0.64 1.04 0.70 0.73
16 Turkey 0.29 0.23 0.46 0.79 0.52 0.57
17 Greece 0.37 0.33 0.46 1.36 0.65 0.84
18 Korea, Republic of 0.00 0.70 0.89 0.59 0.54 0.61
19 Egypt 0.13 1.64 0.38 0.33 0.32 0.36
20 Portugal 2.71 0.84 0.78 0.59 0.30 0.56
21 Nigeria 0.26 0.28 0.55 0.43 0.28 0.33
22 Malaysia . 13.81 1.87 0.62 0.76 1.30
23 Brazil 0.31 0.39 0.37 0.56 0.54 0.45
24 Hungary 0.09 0.41 0.59 0.46 0.14 0.31
25 Ireland 0.42 0.23 3.94 0.76 0.94 0.91
26 Finland 0.41 0.43 0.34 1.01 0.37 0.47
27 Mexico 0.32 0.23 0.91 0.60 0.27 0.42
28 New Zealand 0.43 0.25 1.20 1.45 0.59 0.79
29 Denmark . 1.56 0.96 1.22 0.99 1.14
30 Czech Republic 0.25 0.28 0.26 0.38 0.78 0.40
31 Taiwan 0.66 0.20 0.17 0.22 0.31 0.25
32 Argentina 0.20 0.21 0.78 0.37 0.29 0.41
33 Poland . 0.15 0.10 0.23 0.33 0.26
34 USSR 0.11 . . . . 0.11
35 Belgium 0.28 0.21 0.57 1.44 1.27 1.05
36 Norway 0.41 0.55 2.62 0.61 0.89 0.82
37 Saudi Arabia 0.15 0.12 . 0.16 0.33 0.27
38 Netherlands 1.39 0.03 1.16 1.14 1.22 1.06
39 Ukraine . 0.11 0.02 0.24 0.05 0.09
40 Thailand . . 1.41 1.47 0.53 0.81
41 Iran, Islamic Republic of . . . 0.17 0.28 0.27
42 Austria 0.25 . 1.26 1.10 0.53 0.96
43 South Africa 0.50 . 6.33 0.83 0.61 1.35
44 Czechoslovakia 0.26 . . . . 0.26
45 Israel 1.29 0.50 . 1.82 0.26 1.04
46 Senegal 0.00 0.98 0.72 . . 0.80
47 Indonesia . 0.21 0.28 0.36 0.31 0.29
48 Jordan . . 0.38 0.51 0.00 0.43
49 Pakistan . . . . 0.35 0.35
50 Slovak Republic 0.15 0.30 . 0.39 0.37 0.33
51 Syrian Arab Republic . . 0.00 0.20 0.39 0.27

Field normalized citation rate (cf), fractionalized


Bar chart of publication_year