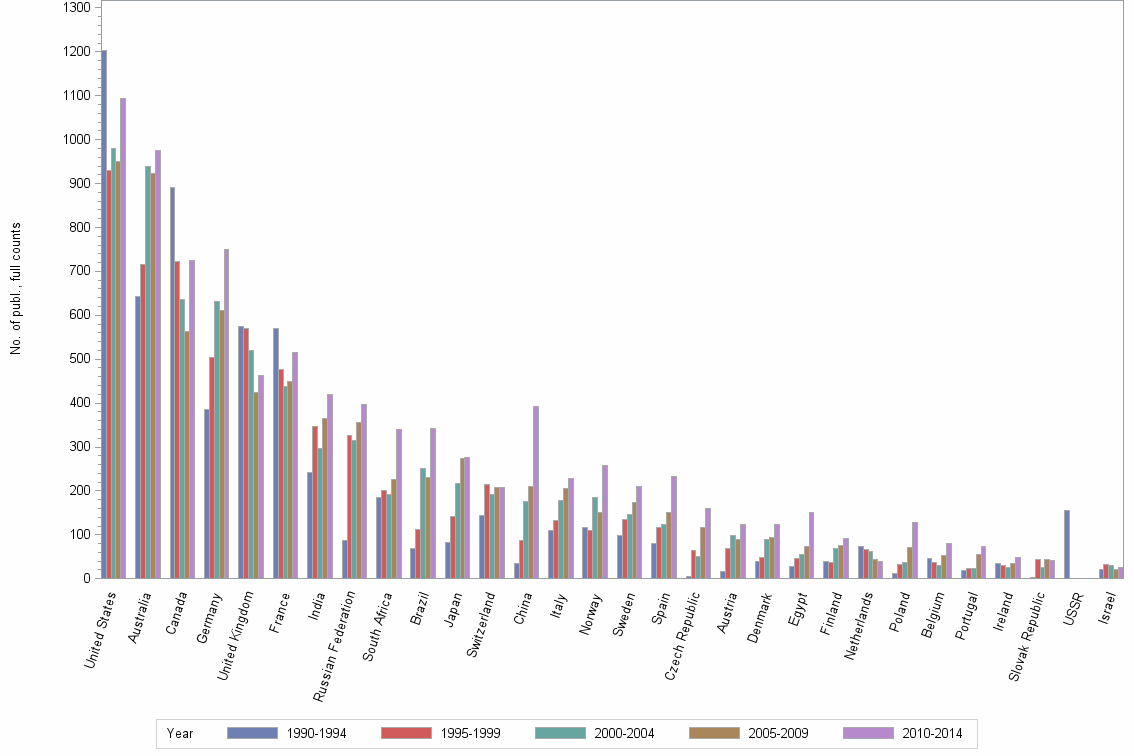
Lev2: PRECAMBRIAN RESEARCH//JOURNAL OF METAMORPHIC GEOLOGY//MINERALOGY - Statistics for Countries

Statistics per Country

Number of publications, full counts

Obs Country 1990-1994 1995-1999 2000-2004 2005-2009 2010-2014 All years
1 All countries 5173 5182 5175 5080 5746 26356
2 United States 1204 930 979 950 1093 5156
3 Australia 642 715 938 924 976 4195
4 Canada 890 723 635 563 724 3535
5 Germany 386 503 632 612 751 2884
6 United Kingdom 574 569 520 424 464 2551
7 France 570 476 437 450 515 2448
8 India 241 347 297 364 420 1669
9 Russian Federation 87 326 315 355 396 1479
10 South Africa 186 201 192 225 339 1143
11 Brazil 69 112 251 231 343 1006
12 Japan 83 142 216 274 277 992
13 Switzerland 145 215 193 208 207 968
14 China 34 87 177 209 393 900
15 Italy 110 132 178 206 228 854
16 Norway 116 110 184 152 258 820
17 Sweden 98 135 146 173 209 761
18 Spain 80 116 124 151 233 704
19 Czech Republic 5 65 51 117 161 399
20 Austria 16 70 98 90 123 397
21 Denmark 40 49 90 93 124 396
22 Egypt 27 45 56 73 150 351
23 Finland 39 38 69 75 92 313
24 Netherlands 73 66 62 44 40 285
25 Poland 12 32 38 72 129 283
26 Belgium 46 36 31 53 80 246
27 Portugal 18 23 24 55 73 193
28 Ireland 34 30 26 35 48 173
29 Slovak Republic 2 44 26 44 41 157
30 USSR 156 . . . . 156
31 Israel 21 32 31 21 26 131
32 New Zealand 21 21 19 28 29 118
33 Cameroon 16 7 11 32 34 100
34 Argentina 5 13 18 22 35 93
35 Saudi Arabia 1 10 17 9 43 80
36 Tanzania 6 13 17 16 25 77
37 Zimbabwe 17 27 28 5 . 77
38 Botswana 4 10 23 30 8 75
39 Mexico 3 16 16 10 19 64
40 Iran, Islamic Republic of 1 2 4 24 30 61
41 Ukraine 4 10 15 9 20 58
42 Madagascar 3 12 14 9 17 55
43 Korea, Republic of 2 5 12 13 21 53
44 Hungary 2 4 10 11 23 50
45 Nigeria 17 10 6 6 8 47
46 Algeria 5 7 17 5 10 44
47 Uruguay 2 4 7 8 19 40
48 Turkey 2 5 8 10 13 38
49 Taiwan 1 1 8 8 19 37
50 Congo 9 3 1 17 6 36
51 Greece 1 13 4 7 7 32
52 Morocco 5 5 7 10 5 32
53 Sri Lanka 5 6 10 5 6 32

Number of publications, full counts


Bar chart of publication_year

Share of the total number of publications in the field, full counts (%)

Obs Country 1990-1994 1995-1999 2000-2004 2005-2009 2010-2014 All years
1 All countries 100.0 100.0 100.0 100.0 100.0 100.0
2 United States 23.3 17.9 18.9 18.7 19.0 19.6
3 Australia 12.4 13.8 18.1 18.2 17.0 15.9
4 Canada 17.2 14.0 12.3 11.1 12.6 13.4
5 Germany 7.5 9.7 12.2 12.0 13.1 10.9
6 United Kingdom 11.1 11.0 10.0 8.3 8.1 9.7
7 France 11.0 9.2 8.4 8.9 9.0 9.3
8 India 4.7 6.7 5.7 7.2 7.3 6.3
9 Russian Federation 1.7 6.3 6.1 7.0 6.9 5.6
10 South Africa 3.6 3.9 3.7 4.4 5.9 4.3
11 Brazil 1.3 2.2 4.9 4.5 6.0 3.8
12 Japan 1.6 2.7 4.2 5.4 4.8 3.8
13 Switzerland 2.8 4.1 3.7 4.1 3.6 3.7
14 China 0.7 1.7 3.4 4.1 6.8 3.4
15 Italy 2.1 2.5 3.4 4.1 4.0 3.2
16 Norway 2.2 2.1 3.6 3.0 4.5 3.1
17 Sweden 1.9 2.6 2.8 3.4 3.6 2.9
18 Spain 1.5 2.2 2.4 3.0 4.1 2.7
19 Czech Republic 0.1 1.3 1.0 2.3 2.8 1.5
20 Austria 0.3 1.4 1.9 1.8 2.1 1.5
21 Denmark 0.8 0.9 1.7 1.8 2.2 1.5
22 Egypt 0.5 0.9 1.1 1.4 2.6 1.3
23 Finland 0.8 0.7 1.3 1.5 1.6 1.2
24 Netherlands 1.4 1.3 1.2 0.9 0.7 1.1
25 Poland 0.2 0.6 0.7 1.4 2.2 1.1
26 Belgium 0.9 0.7 0.6 1.0 1.4 0.9
27 Portugal 0.3 0.4 0.5 1.1 1.3 0.7
28 Ireland 0.7 0.6 0.5 0.7 0.8 0.7
29 Slovak Republic 0.0 0.8 0.5 0.9 0.7 0.6
30 USSR 3.0 . . . . 0.6
31 Israel 0.4 0.6 0.6 0.4 0.5 0.5
32 New Zealand 0.4 0.4 0.4 0.6 0.5 0.4
33 Cameroon 0.3 0.1 0.2 0.6 0.6 0.4
34 Argentina 0.1 0.3 0.3 0.4 0.6 0.4
35 Saudi Arabia 0.0 0.2 0.3 0.2 0.7 0.3
36 Tanzania 0.1 0.3 0.3 0.3 0.4 0.3
37 Zimbabwe 0.3 0.5 0.5 0.1 . 0.3
38 Botswana 0.1 0.2 0.4 0.6 0.1 0.3
39 Mexico 0.1 0.3 0.3 0.2 0.3 0.2
40 Iran, Islamic Republic of 0.0 0.0 0.1 0.5 0.5 0.2
41 Ukraine 0.1 0.2 0.3 0.2 0.3 0.2
42 Madagascar 0.1 0.2 0.3 0.2 0.3 0.2
43 Korea, Republic of 0.0 0.1 0.2 0.3 0.4 0.2
44 Hungary 0.0 0.1 0.2 0.2 0.4 0.2
45 Nigeria 0.3 0.2 0.1 0.1 0.1 0.2
46 Algeria 0.1 0.1 0.3 0.1 0.2 0.2
47 Uruguay 0.0 0.1 0.1 0.2 0.3 0.2
48 Turkey 0.0 0.1 0.2 0.2 0.2 0.1
49 Taiwan 0.0 0.0 0.2 0.2 0.3 0.1
50 Congo 0.2 0.1 0.0 0.3 0.1 0.1
51 Greece 0.0 0.3 0.1 0.1 0.1 0.1
52 Morocco 0.1 0.1 0.1 0.2 0.1 0.1
53 Sri Lanka 0.1 0.1 0.2 0.1 0.1 0.1

Share of the total number of publications in the field, full counts (%)


Bar chart of publication_year

Number of publications among 10% most cited in field, full counts

Obs Country 1990-1994 1995-1999 2000-2004 2005-2009 2010-2014 All years
1 All countries 611.3 533.4 492.5 498.3 608.4 2743.8
2 United States 214.5 154.6 165.3 186.8 222.2 943.4
3 Australia 84.8 114.4 152.7 135.0 162.6 649.4
4 Canada 97.4 60.2 63.4 59.3 97.1 377.3
5 Germany 68.2 69.8 73.3 72.5 103.4 387.3
6 United Kingdom 84.3 82.9 61.9 68.7 74.3 372.1
7 France 63.7 55.6 54.0 52.4 99.6 325.2
8 India 12.5 12.9 14.3 16.2 38.4 94.2
9 Russian Federation 4.0 11.5 5.7 11.0 26.4 58.6
10 South Africa 19.1 25.8 17.1 23.6 48.0 133.6
11 Brazil 8.0 12.5 13.0 8.0 21.5 63.0
12 Japan 11.0 11.3 16.1 24.3 23.0 85.7
13 Switzerland 31.4 36.0 34.0 35.3 43.2 179.9
14 China 1.5 3.0 15.0 16.8 50.6 86.9
15 Italy 7.0 11.8 10.2 15.8 19.7 64.5
16 Norway 10.5 8.0 23.1 28.1 39.8 109.5
17 Sweden 9.0 18.6 16.1 21.5 27.8 93.0
18 Spain 6.1 13.5 9.5 13.2 28.8 71.1
19 Czech Republic 1.0 7.0 8.0 11.3 14.6 41.9
20 Austria 3.0 4.1 7.0 3.4 9.4 26.9
21 Denmark 2.0 9.3 18.0 21.0 24.8 75.1
22 Egypt 4.0 2.0 4.0 4.0 6.8 20.8
23 Finland 8.0 5.5 5.3 5.5 6.6 30.9
24 Netherlands 2.1 8.9 5.5 2.5 5.0 24.0
25 Poland 1.0 4.0 1.0 3.0 8.1 17.1
26 Belgium 8.5 10.5 3.0 3.0 8.9 33.9
27 Portugal 0.0 0.5 0.0 4.0 6.7 11.2
28 Ireland 3.0 2.0 1.0 0.0 7.0 13.0
29 Slovak Republic 0.0 1.2 0.5 0.0 2.3 4.0
30 USSR 3.0 . . . . 3.0
31 Israel 3.0 3.0 3.0 5.0 12.9 26.9
32 New Zealand 0.0 0.0 0.0 1.0 1.0 2.0
33 Cameroon 2.0 0.0 2.5 0.0 0.0 4.5
34 Argentina 0.0 0.5 1.0 2.7 2.8 7.0
35 Saudi Arabia 0.0 1.0 1.0 1.0 4.1 7.1
36 Tanzania 1.0 0.0 0.0 0.0 4.0 5.0
37 Zimbabwe 1.0 4.5 2.0 0.0 . 7.5
38 Botswana 0.0 1.0 0.0 2.0 1.0 4.0
39 Mexico 0.0 1.0 4.0 1.0 2.0 8.0
40 Iran, Islamic Republic of 0.0 0.0 0.0 1.0 2.1 3.1
41 Ukraine 0.0 1.0 0.0 0.0 0.5 1.5
42 Madagascar 1.0 2.0 3.0 0.0 4.5 10.5
43 Korea, Republic of 1.0 0.0 1.0 0.0 0.0 2.0
44 Hungary 0.0 0.0 1.0 0.0 1.7 2.7
45 Nigeria 0.0 0.0 0.0 0.0 0.0 0.0
46 Algeria 0.0 1.0 0.0 0.0 1.0 2.0
47 Uruguay 0.0 0.0 0.0 4.0 1.0 5.0
48 Turkey 0.0 0.0 1.0 0.0 0.0 1.0
49 Taiwan 0.0 0.0 0.0 1.0 2.9 3.9
50 Congo 0.0 0.0 0.0 1.5 1.5 3.0
51 Greece 0.0 0.0 0.0 0.0 1.0 1.0
52 Morocco 0.0 0.0 0.0 2.0 0.1 2.1
53 Sri Lanka 0.0 0.0 0.0 0.0 0.0 0.0

Number of publications among 10% most cited in field, full counts


Bar chart of publication_year

Share of publications among 10% most cited in field, fractionalized (%)

Obs Country 1990-1994 1995-1999 2000-2004 2005-2009 2010-2014 All years
1 All countries 11.8 10.3 9.5 9.8 10.6 10.4
2 United States 18.0 16.0 16.3 20.6 19.0 17.9
3 Australia 12.3 14.2 14.8 12.8 14.6 13.8
4 Canada 10.7 7.0 7.9 8.1 9.2 8.7
5 Germany 14.6 13.5 10.3 11.1 10.9 11.9
6 United Kingdom 13.7 12.6 9.6 12.7 12.2 12.3
7 France 11.0 10.8 11.5 11.1 17.4 12.2
8 India 3.8 2.3 3.6 2.8 5.3 3.6
9 Russian Federation 4.6 1.6 1.3 1.6 2.6 2.0
10 South Africa 8.2 9.1 5.5 9.4 9.3 8.4
11 Brazil 13.1 12.2 3.5 3.1 4.5 5.3
12 Japan 13.2 6.6 5.4 7.7 6.4 7.2
13 Switzerland 20.8 16.6 16.7 15.5 18.2 17.5
14 China 1.8 2.3 5.4 5.2 10.6 6.9
15 Italy 5.2 6.8 4.3 5.0 6.7 5.6
16 Norway 9.4 4.7 11.8 13.1 13.3 10.9
17 Sweden 7.9 11.5 7.8 9.7 8.9 9.3
18 Spain 6.6 13.8 6.6 8.3 11.0 9.6
19 Czech Republic 13.6 10.5 9.1 9.2 7.5 8.7
20 Austria 19.5 5.6 6.7 4.7 4.9 6.3
21 Denmark 4.8 17.3 21.7 19.9 18.5 17.7
22 Egypt 8.8 2.1 4.3 3.6 2.6 3.6
23 Finland 22.8 15.4 10.3 6.2 5.9 10.4
24 Netherlands 1.6 13.5 7.2 6.4 9.7 7.1
25 Poland 3.3 11.5 0.8 2.9 3.1 3.6
26 Belgium 19.3 27.4 6.7 6.4 8.1 13.4
27 Portugal 0.0 1.0 0.0 4.9 6.8 4.0
28 Ireland 4.5 3.1 1.1 0.0 12.7 4.4
29 Slovak Republic 0.0 3.3 1.7 0.0 3.5 2.2
30 USSR 2.0 . . . . 2.0
31 Israel 11.1 6.1 7.8 23.5 40.8 15.7
32 New Zealand 0.0 0.0 0.0 3.2 1.1 0.9
33 Cameroon 7.1 0.0 15.3 0.0 0.0 3.0
34 Argentina 0.0 2.2 3.7 5.4 4.7 4.0
35 Saudi Arabia 0.0 4.4 4.7 7.1 4.4 4.7
36 Tanzania 11.5 0.0 0.0 0.0 10.5 3.9
37 Zimbabwe 10.5 14.1 2.2 0.0 . 8.8
38 Botswana 0.0 9.2 0.0 3.7 8.1 3.2
39 Mexico 0.0 6.6 24.1 4.7 4.8 9.4
40 Iran, Islamic Republic of 0.0 0.0 0.0 3.0 4.4 3.3
41 Ukraine 0.0 8.1 0.0 0.0 1.9 2.0
42 Madagascar 37.5 11.7 23.0 0.0 23.7 17.3
43 Korea, Republic of 40.0 0.0 5.7 0.0 0.0 2.6
44 Hungary 0.0 0.0 4.8 0.0 1.5 1.9
45 Nigeria 0.0 0.0 0.0 0.0 0.0 0.0
46 Algeria 0.0 8.2 0.0 0.0 11.1 3.6
47 Uruguay 0.0 0.0 0.0 37.4 2.0 6.1
48 Turkey 0.0 0.0 13.3 0.0 0.0 3.4
49 Taiwan 0.0 0.0 0.0 21.7 14.1 10.1
50 Congo 0.0 0.0 0.0 9.3 13.3 5.2
51 Greece 0.0 0.0 0.0 0.0 17.8 2.6
52 Morocco 0.4 0.0 0.0 15.2 0.5 4.2
53 Sri Lanka 0.0 0.0 0.0 0.0 0.0 0.0

Share of publications among 10% most cited in field, fractionalized (%)


Bar chart of publication_year

Field normalized citation rate (cf), fractionalized

Obs Country 1990-1994 1995-1999 2000-2004 2005-2009 2010-2014 All years
1 All countries 1.14 1.02 0.98 0.99 1.04 1.03
2 United States 1.61 1.43 1.42 1.64 1.65 1.55
3 Australia 1.20 1.34 1.32 1.21 1.36 1.29
4 Canada 1.15 0.87 0.93 0.90 0.97 0.98
5 Germany 1.30 1.21 1.06 1.13 1.11 1.15
6 United Kingdom 1.24 1.13 1.05 1.25 1.28 1.18
7 France 1.00 1.09 1.08 1.11 1.32 1.11
8 India 0.53 0.39 0.45 0.40 0.62 0.48
9 Russian Federation 0.34 0.23 0.25 0.30 0.34 0.29
10 South Africa 0.99 1.00 0.83 0.93 1.03 0.96
11 Brazil 1.09 1.05 0.74 0.65 0.69 0.76
12 Japan 1.08 0.80 0.76 0.89 0.79 0.84
13 Switzerland 1.64 1.39 1.42 1.50 1.36 1.46
14 China 0.23 0.33 0.42 0.66 0.95 0.67
15 Italy 0.85 0.97 0.71 0.75 0.79 0.80
16 Norway 1.05 0.85 1.21 1.29 1.16 1.13
17 Sweden 0.94 1.04 0.85 0.97 0.94 0.95
18 Spain 0.89 1.26 0.84 0.84 1.05 0.99
19 Czech Republic 1.01 0.98 0.94 0.94 0.82 0.90
20 Austria 1.13 0.90 0.77 0.95 0.72 0.85
21 Denmark 0.85 1.82 1.69 1.30 1.67 1.51
22 Egypt 0.71 0.45 0.55 0.64 0.56 0.57
23 Finland 1.24 1.03 0.89 0.83 0.81 0.92
24 Netherlands 0.70 0.99 0.96 1.04 0.95 0.90
25 Poland 0.60 1.00 0.37 0.45 0.59 0.57
26 Belgium 1.13 1.72 1.18 0.81 0.99 1.14
27 Portugal 0.63 0.75 0.66 0.74 0.72 0.71
28 Ireland 0.71 0.54 0.61 0.64 0.95 0.69
29 Slovak Republic 0.58 0.42 0.78 0.54 0.57 0.55
30 USSR 0.16 . . . . 0.16
31 Israel 0.58 1.01 0.78 1.56 2.13 1.13
32 New Zealand 0.69 0.58 0.67 0.70 0.80 0.69
33 Cameroon 0.83 0.39 1.41 0.71 0.25 0.63
34 Argentina 0.23 0.40 0.52 0.49 0.47 0.46
35 Saudi Arabia 0.52 0.42 0.67 0.63 0.60 0.59
36 Tanzania 1.03 0.72 0.90 0.61 0.66 0.76
37 Zimbabwe 1.07 0.88 0.76 0.26 . 0.85
38 Botswana 0.36 0.65 0.64 0.81 0.76 0.69
39 Mexico 0.38 0.61 1.43 0.82 0.64 0.81
40 Iran, Islamic Republic of 1.35 0.17 0.32 0.46 0.46 0.45
41 Ukraine 0.71 1.07 0.13 0.27 0.29 0.39
42 Madagascar 3.19 0.94 1.66 1.08 1.17 1.38
43 Korea, Republic of 1.14 0.64 0.46 0.61 0.57 0.57
44 Hungary 1.00 0.75 0.52 0.29 0.38 0.47
45 Nigeria 0.17 0.48 0.12 0.24 0.39 0.26
46 Algeria 0.87 1.16 0.39 0.52 1.10 0.72
47 Uruguay 0.50 0.40 0.93 1.89 0.62 0.85
48 Turkey 0.22 0.40 0.74 0.19 0.16 0.36
49 Taiwan 0.18 0.03 0.24 1.49 1.57 1.04
50 Congo 0.85 0.36 0.41 1.14 1.72 1.02
51 Greece 0.22 0.15 0.68 0.48 1.23 0.42
52 Morocco 0.21 0.11 0.31 1.31 0.48 0.53
53 Sri Lanka 0.50 0.45 0.27 0.18 0.33 0.35

Field normalized citation rate (cf), fractionalized


Bar chart of publication_year