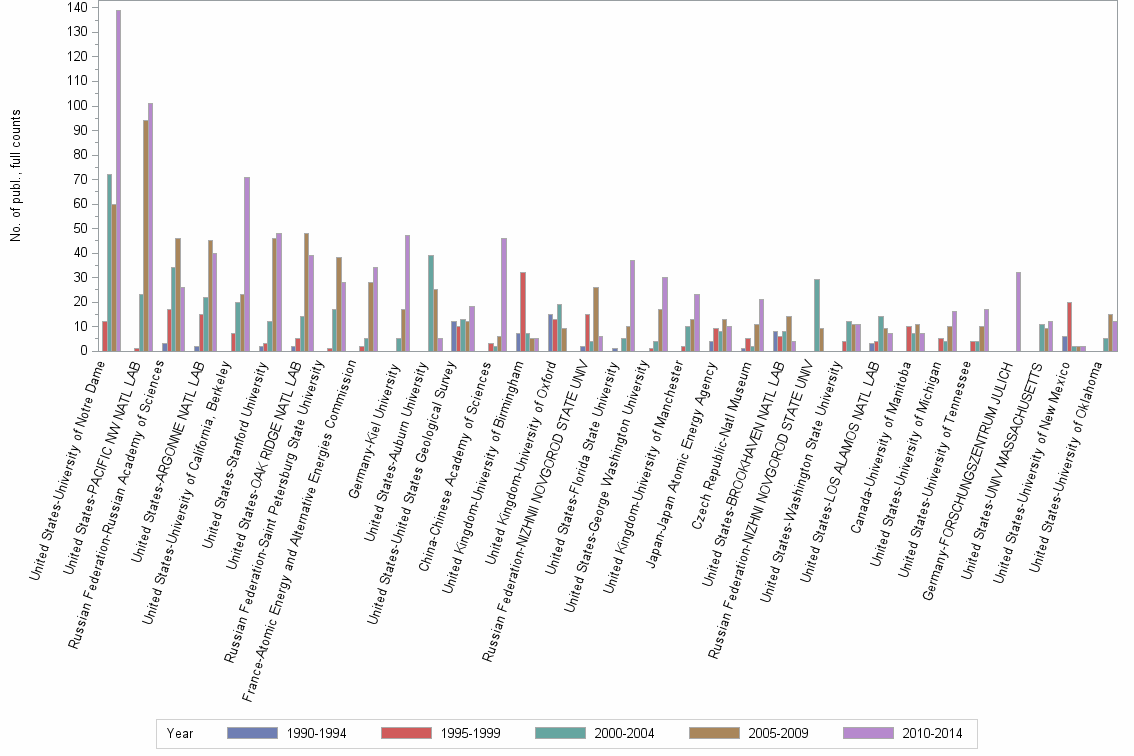
Lev2: RADIOCHIMICA ACTA//URANIUM//NEPTUNIUM - Statistics for Organizations

Statistics per Organization

Number of publications, full counts

Obs Organization 1990-1994 1995-1999 2000-2004 2005-2009 2010-2014 All years
1 All organizations 216 314 501 742 962 2735
2 United States-University of Notre Dame . 12 72 60 139 283
3 United States-PACIFIC NW NATL LAB . 1 23 94 101 219
4 Russian Federation-Russian Academy of Sciences 3 17 34 46 26 126
5 United States-ARGONNE NATL LAB 2 15 22 45 40 124
6 United States-University of California, Berkeley . 7 20 23 71 121
7 United States-Stanford University 2 3 12 46 48 111
8 United States-OAK RIDGE NATL LAB 2 5 14 48 39 108
9 Russian Federation-Saint Petersburg State University . 1 17 38 28 84
10 France-Atomic Energy and Alternative Energies Commission . 2 5 28 34 69
11 Germany-Kiel University . . 5 17 47 69
12 United States-Auburn University . . 39 25 5 69
13 United States-United States Geological Survey 12 10 13 12 18 65
14 China-Chinese Academy of Sciences . 3 2 6 46 57
15 United Kingdom-University of Birmingham 7 32 7 5 5 56
16 United Kingdom-University of Oxford 15 13 19 9 . 56
17 Russian Federation-NIZHNII NOVGOROD STATE UNIV 2 15 4 26 6 53
18 United States-Florida State University 1 . 5 10 37 53
19 United States-George Washington University . 1 4 17 30 52
20 United Kingdom-University of Manchester . 2 10 13 23 48
21 Japan-Japan Atomic Energy Agency 4 9 8 13 10 44
22 Czech Republic-Natl Museum 1 5 2 11 21 40
23 United States-BROOKHAVEN NATL LAB 8 6 8 14 4 40
24 Russian Federation-NIZHNI NOVGOROD STATE UNIV . . 29 9 . 38
25 United States-Washington State University . 4 12 11 11 38
26 United States-LOS ALAMOS NATL LAB 3 4 14 9 7 37
27 Canada-University of Manitoba . 10 7 11 7 35
28 United States-University of Michigan . 5 4 10 16 35
29 United States-University of Tennessee . 4 4 10 17 35
30 Germany-FORSCHUNGSZENTRUM JULICH . . . . 32 32
31 United States-UNIV MASSACHUSETTS . . 11 9 12 32
32 United States-University of New Mexico 6 20 2 2 2 32
33 United States-University of Oklahoma . . 5 15 12 32
34 Switzerland-École Polytechnique Fédérale de Lausanne 1 . . 9 21 31
35 Germany-FORSCHUNGSZENTRUM ROSSENDORF EV . 4 13 12 . 29
36 Germany-ROSSENDORF INC . 15 11 3 . 29
37 United States-Washington University in St. Louis . 1 . 9 19 29
38 United States-Georgia Institute of Technology 1 1 2 11 13 28
39 Russian Federation-NI LOBACHEVSKII STATE UNIV 9 9 6 1 2 27
40 Taiwan-National Central University . . 1 11 14 26
41 United States-University of Wisconsin - Madison 2 1 4 14 5 26
42 Taiwan-ACADEMIA SINICA - TAIWAN . . 1 10 14 25
43 Germany-Karlsruhe Institute of Technology 3 2 5 8 6 24
44 United States-LAWRENCE BERKELEY NATL LAB . . 8 8 8 24
45 United States-SANDIA NATL LABS . 2 5 5 12 24
46 Australia-AUSTRALIAN NUCL SCI & TECHNOL ORG 5 3 8 2 4 22
47 Russian Federation-SAMARA STATE UNIV 3 5 4 6 4 22
48 France-University of Paris-Sud 11 . 1 3 8 9 21
49 Germany-RWTH Aachen University . . . . 21 21
50 Korea, Republic of-KOREA ATOMIC ENERGY RESEARCH INSTITUTE . 1 5 5 10 21
51 Czech Republic-MASARYK UNIV . . 1 1 18 20
52 France-Univ Lille Nord France . . . . 20 20
53 Germany-Helmholtz Zentrum Dresden Rossendorf . . . . 20 20
54 United States-University of Georgia 1 7 7 1 4 20
55 United States-Oregon State University . . 6 7 6 19
56 United States-The University of Alabama . . 2 2 15 19
57 France-French National Centre for Scientific Research 1 3 1 8 5 18
58 Germany-Forschungszentrum Dresden Rossendorf . . . 10 8 18
59 India-BHABHA ATOM RES CTR 1 . 3 4 10 18
60 United States-Carnegie Institution . . 3 14 . 17
61 United States-MONTANA STATE UNIV . . 4 6 7 17
62 United States-University of Illinois at Urbana-Champaign . 3 1 8 5 17
63 Czech Republic-INST PHYS ASCR . . . . 16 16
64 United States-Stony Brook University, The State University of New York 1 . 7 6 2 16
65 United States-University of California, Davis . . 1 4 11 16
66 China-Jilin University . . 3 5 7 15
67 Russian Federation-Lomonosov Moscow State University 1 2 5 2 5 15
68 United States-Michigan State University . . . 5 10 15
69 United States-University of South Carolina . . . . 15 15
70 Czech Republic-Charles University in Prague . . 1 4 9 14
71 United States-COLORADO SCH MINES . 3 3 4 4 14
72 United States-Pennsylvania State University 1 . 1 7 5 14
73 United States-Princeton University . . 1 6 7 14
74 United States-University of Chicago 1 1 3 8 1 14
75 United States-University of Missouri 2 1 3 7 1 14
76 Australia-University of New South Wales 1 2 3 1 6 13
77 Austria-Innsbruck University . . 2 11 . 13
78 Belgium-University of Antwerp 4 9 . . . 13
79 Czech Republic-CZECH GEOL SURVEY . 2 3 1 7 13
80 France-University Pierre and Marie Curie 6 1 1 1 4 13
81 Germany-University of Jena . . . 5 8 13
82 United States-Clemson University . 4 4 2 3 13
83 Japan-University of Tokyo 1 3 2 4 2 12
84 Russian Federation-Lobachevskii Nizhni Novgorod State Univ . 1 8 . 3 12
85 Sweden-Royal Institute of Technology 3 . 2 3 4 12
86 China-Changchun Univ Sci & Technol . . . . 11 11
87 Spain-Universitat Politècnica de Catalunya 2 2 . 4 3 11
88 Switzerland-University of Basel . . 1 7 3 11
89 United States-Johns Hopkins University . . 2 7 2 11
90 United States-LAWRENCE BERKELEY LAB 1 . 3 7 . 11
91 United States-UNIV MINNESOTA . . . . 11 11
92 United States-University of Arizona . . . 4 7 11
93 Australia-Queensland University of Technology . . . 10 . 10
94 China-Lanzhou University . . 1 4 5 10
95 Italy-Sapienza University of Rome . . 2 6 2 10
96 Japan-TOHO UNIV . 1 2 6 1 10
97 United Kingdom-University of Bristol 1 . 1 6 2 10
98 United States-TEXAS A&M UNIV . 6 . 2 2 10
99 France-USTL . . 5 3 1 9
100 Germany-Helmholtz Zentrum Dresden Rossendorf eV . . . . 9 9
101 United Kingdom-BNFL . 1 6 2 . 9
102 United Kingdom-University of Leeds . . 1 1 7 9
103 United States-LAWRENCE LIVERMORE NATL LAB . 5 . 2 2 9
104 United States-Miami University . . . 7 2 9
105 United States-Savannah River Natl Lab . . . 2 7 9
106 United States-SLAC . . 1 4 4 9
107 United States-WESTINGHOUSE SAVANNAH RIVER CO . 1 6 2 . 9

Number of publications, full counts


Bar chart of publication_year

Share of the total number of publications in the field, full counts (%)

Obs Organization 1990-1994 1995-1999 2000-2004 2005-2009 2010-2014 All years
1 All organizations 100.0 100.0 100.0 100.0 100.0 100.0
2 United States-University of Notre Dame . 3.8 14.4 8.1 14.4 10.3
3 United States-PACIFIC NW NATL LAB . 0.3 4.6 12.7 10.5 8.0
4 Russian Federation-Russian Academy of Sciences 1.4 5.4 6.8 6.2 2.7 4.6
5 United States-ARGONNE NATL LAB 0.9 4.8 4.4 6.1 4.2 4.5
6 United States-University of California, Berkeley . 2.2 4.0 3.1 7.4 4.4
7 United States-Stanford University 0.9 1.0 2.4 6.2 5.0 4.1
8 United States-OAK RIDGE NATL LAB 0.9 1.6 2.8 6.5 4.1 3.9
9 Russian Federation-Saint Petersburg State University . 0.3 3.4 5.1 2.9 3.1
10 France-Atomic Energy and Alternative Energies Commission . 0.6 1.0 3.8 3.5 2.5
11 Germany-Kiel University . . 1.0 2.3 4.9 2.5
12 United States-Auburn University . . 7.8 3.4 0.5 2.5
13 United States-United States Geological Survey 5.6 3.2 2.6 1.6 1.9 2.4
14 China-Chinese Academy of Sciences . 1.0 0.4 0.8 4.8 2.1
15 United Kingdom-University of Birmingham 3.2 10.2 1.4 0.7 0.5 2.0
16 United Kingdom-University of Oxford 6.9 4.1 3.8 1.2 . 2.0
17 Russian Federation-NIZHNII NOVGOROD STATE UNIV 0.9 4.8 0.8 3.5 0.6 1.9
18 United States-Florida State University 0.5 . 1.0 1.3 3.8 1.9
19 United States-George Washington University . 0.3 0.8 2.3 3.1 1.9
20 United Kingdom-University of Manchester . 0.6 2.0 1.8 2.4 1.8
21 Japan-Japan Atomic Energy Agency 1.9 2.9 1.6 1.8 1.0 1.6
22 Czech Republic-Natl Museum 0.5 1.6 0.4 1.5 2.2 1.5
23 United States-BROOKHAVEN NATL LAB 3.7 1.9 1.6 1.9 0.4 1.5
24 Russian Federation-NIZHNI NOVGOROD STATE UNIV . . 5.8 1.2 . 1.4
25 United States-Washington State University . 1.3 2.4 1.5 1.1 1.4
26 United States-LOS ALAMOS NATL LAB 1.4 1.3 2.8 1.2 0.7 1.4
27 Canada-University of Manitoba . 3.2 1.4 1.5 0.7 1.3
28 United States-University of Michigan . 1.6 0.8 1.3 1.7 1.3
29 United States-University of Tennessee . 1.3 0.8 1.3 1.8 1.3
30 Germany-FORSCHUNGSZENTRUM JULICH . . . . 3.3 1.2
31 United States-UNIV MASSACHUSETTS . . 2.2 1.2 1.2 1.2
32 United States-University of New Mexico 2.8 6.4 0.4 0.3 0.2 1.2
33 United States-University of Oklahoma . . 1.0 2.0 1.2 1.2
34 Switzerland-École Polytechnique Fédérale de Lausanne 0.5 . . 1.2 2.2 1.1
35 Germany-FORSCHUNGSZENTRUM ROSSENDORF EV . 1.3 2.6 1.6 . 1.1
36 Germany-ROSSENDORF INC . 4.8 2.2 0.4 . 1.1
37 United States-Washington University in St. Louis . 0.3 . 1.2 2.0 1.1
38 United States-Georgia Institute of Technology 0.5 0.3 0.4 1.5 1.4 1.0
39 Russian Federation-NI LOBACHEVSKII STATE UNIV 4.2 2.9 1.2 0.1 0.2 1.0
40 Taiwan-National Central University . . 0.2 1.5 1.5 1.0
41 United States-University of Wisconsin - Madison 0.9 0.3 0.8 1.9 0.5 1.0
42 Taiwan-ACADEMIA SINICA - TAIWAN . . 0.2 1.3 1.5 0.9
43 Germany-Karlsruhe Institute of Technology 1.4 0.6 1.0 1.1 0.6 0.9
44 United States-LAWRENCE BERKELEY NATL LAB . . 1.6 1.1 0.8 0.9
45 United States-SANDIA NATL LABS . 0.6 1.0 0.7 1.2 0.9
46 Australia-AUSTRALIAN NUCL SCI & TECHNOL ORG 2.3 1.0 1.6 0.3 0.4 0.8
47 Russian Federation-SAMARA STATE UNIV 1.4 1.6 0.8 0.8 0.4 0.8
48 France-University of Paris-Sud 11 . 0.3 0.6 1.1 0.9 0.8
49 Germany-RWTH Aachen University . . . . 2.2 0.8
50 Korea, Republic of-KOREA ATOMIC ENERGY RESEARCH INSTITUTE . 0.3 1.0 0.7 1.0 0.8
51 Czech Republic-MASARYK UNIV . . 0.2 0.1 1.9 0.7
52 France-Univ Lille Nord France . . . . 2.1 0.7
53 Germany-Helmholtz Zentrum Dresden Rossendorf . . . . 2.1 0.7
54 United States-University of Georgia 0.5 2.2 1.4 0.1 0.4 0.7
55 United States-Oregon State University . . 1.2 0.9 0.6 0.7
56 United States-The University of Alabama . . 0.4 0.3 1.6 0.7
57 France-French National Centre for Scientific Research 0.5 1.0 0.2 1.1 0.5 0.7
58 Germany-Forschungszentrum Dresden Rossendorf . . . 1.3 0.8 0.7
59 India-BHABHA ATOM RES CTR 0.5 . 0.6 0.5 1.0 0.7
60 United States-Carnegie Institution . . 0.6 1.9 . 0.6
61 United States-MONTANA STATE UNIV . . 0.8 0.8 0.7 0.6
62 United States-University of Illinois at Urbana-Champaign . 1.0 0.2 1.1 0.5 0.6
63 Czech Republic-INST PHYS ASCR . . . . 1.7 0.6
64 United States-Stony Brook University, The State University of New York 0.5 . 1.4 0.8 0.2 0.6
65 United States-University of California, Davis . . 0.2 0.5 1.1 0.6
66 China-Jilin University . . 0.6 0.7 0.7 0.5
67 Russian Federation-Lomonosov Moscow State University 0.5 0.6 1.0 0.3 0.5 0.5
68 United States-Michigan State University . . . 0.7 1.0 0.5
69 United States-University of South Carolina . . . . 1.6 0.5
70 Czech Republic-Charles University in Prague . . 0.2 0.5 0.9 0.5
71 United States-COLORADO SCH MINES . 1.0 0.6 0.5 0.4 0.5
72 United States-Pennsylvania State University 0.5 . 0.2 0.9 0.5 0.5
73 United States-Princeton University . . 0.2 0.8 0.7 0.5
74 United States-University of Chicago 0.5 0.3 0.6 1.1 0.1 0.5
75 United States-University of Missouri 0.9 0.3 0.6 0.9 0.1 0.5
76 Australia-University of New South Wales 0.5 0.6 0.6 0.1 0.6 0.5
77 Austria-Innsbruck University . . 0.4 1.5 . 0.5
78 Belgium-University of Antwerp 1.9 2.9 . . . 0.5
79 Czech Republic-CZECH GEOL SURVEY . 0.6 0.6 0.1 0.7 0.5
80 France-University Pierre and Marie Curie 2.8 0.3 0.2 0.1 0.4 0.5
81 Germany-University of Jena . . . 0.7 0.8 0.5
82 United States-Clemson University . 1.3 0.8 0.3 0.3 0.5
83 Japan-University of Tokyo 0.5 1.0 0.4 0.5 0.2 0.4
84 Russian Federation-Lobachevskii Nizhni Novgorod State Univ . 0.3 1.6 . 0.3 0.4
85 Sweden-Royal Institute of Technology 1.4 . 0.4 0.4 0.4 0.4
86 China-Changchun Univ Sci & Technol . . . . 1.1 0.4
87 Spain-Universitat Politècnica de Catalunya 0.9 0.6 . 0.5 0.3 0.4
88 Switzerland-University of Basel . . 0.2 0.9 0.3 0.4
89 United States-Johns Hopkins University . . 0.4 0.9 0.2 0.4
90 United States-LAWRENCE BERKELEY LAB 0.5 . 0.6 0.9 . 0.4
91 United States-UNIV MINNESOTA . . . . 1.1 0.4
92 United States-University of Arizona . . . 0.5 0.7 0.4
93 Australia-Queensland University of Technology . . . 1.3 . 0.4
94 China-Lanzhou University . . 0.2 0.5 0.5 0.4
95 Italy-Sapienza University of Rome . . 0.4 0.8 0.2 0.4
96 Japan-TOHO UNIV . 0.3 0.4 0.8 0.1 0.4
97 United Kingdom-University of Bristol 0.5 . 0.2 0.8 0.2 0.4
98 United States-TEXAS A&M UNIV . 1.9 . 0.3 0.2 0.4
99 France-USTL . . 1.0 0.4 0.1 0.3
100 Germany-Helmholtz Zentrum Dresden Rossendorf eV . . . . 0.9 0.3
101 United Kingdom-BNFL . 0.3 1.2 0.3 . 0.3
102 United Kingdom-University of Leeds . . 0.2 0.1 0.7 0.3
103 United States-LAWRENCE LIVERMORE NATL LAB . 1.6 . 0.3 0.2 0.3
104 United States-Miami University . . . 0.9 0.2 0.3
105 United States-Savannah River Natl Lab . . . 0.3 0.7 0.3
106 United States-SLAC . . 0.2 0.5 0.4 0.3
107 United States-WESTINGHOUSE SAVANNAH RIVER CO . 0.3 1.2 0.3 . 0.3

Share of the total number of publications in the field, full counts (%)


Bar chart of publication_year

Number of publications among 10% most cited in field, full counts

Obs Organization 1990-1994 1995-1999 2000-2004 2005-2009 2010-2014 All years
1 All organizations 42.3 65.6 96.6 99.7 116.1 420.3
2 United States-University of Notre Dame . 3.0 12.7 5.7 13.6 34.9
3 United States-PACIFIC NW NATL LAB . 0.3 11.0 17.1 11.8 40.2
4 Russian Federation-Russian Academy of Sciences 0.0 0.0 0.0 3.5 0.5 4.0
5 United States-ARGONNE NATL LAB 1.0 7.0 8.7 7.2 9.8 33.7
6 United States-University of California, Berkeley . 3.8 8.7 3.3 11.0 26.9
7 United States-Stanford University 2.0 2.0 4.8 13.4 13.2 35.5
8 United States-OAK RIDGE NATL LAB 0.0 0.0 6.3 10.4 6.0 22.7
9 Russian Federation-Saint Petersburg State University . 0.0 1.0 2.5 0.0 3.5
10 France-Atomic Energy and Alternative Energies Commission . 1.0 0.5 6.0 10.7 18.2
11 Germany-Kiel University . . 2.0 0.0 2.0 4.0
12 United States-Auburn University . . 8.5 2.0 0.0 10.5
13 United States-United States Geological Survey 8.0 6.0 5.5 2.8 3.0 25.3
14 China-Chinese Academy of Sciences . 1.0 0.7 0.0 8.2 9.8
15 United Kingdom-University of Birmingham 1.0 1.0 0.0 0.0 0.0 2.0
16 United Kingdom-University of Oxford 4.0 3.5 4.0 3.0 . 14.5
17 Russian Federation-NIZHNII NOVGOROD STATE UNIV 0.0 0.0 0.0 0.0 0.0 0.0
18 United States-Florida State University 0.5 . 4.0 2.0 2.7 9.2
19 United States-George Washington University . 0.0 2.0 10.2 10.1 22.2
20 United Kingdom-University of Manchester . 0.0 2.8 1.0 1.0 4.8
21 Japan-Japan Atomic Energy Agency 2.2 1.2 0.0 0.0 0.0 3.4
22 Czech Republic-Natl Museum 0.0 1.0 0.0 0.0 0.1 1.1
23 United States-BROOKHAVEN NATL LAB 4.2 1.5 1.5 0.0 0.0 7.1
24 Russian Federation-NIZHNI NOVGOROD STATE UNIV . . 0.0 0.0 . 0.0
25 United States-Washington State University . 0.3 2.3 1.0 1.0 4.7
26 United States-LOS ALAMOS NATL LAB 2.0 3.0 2.0 1.0 1.0 9.0
27 Canada-University of Manitoba . 4.3 0.0 2.0 0.0 6.3
28 United States-University of Michigan . 1.8 0.7 0.5 2.2 5.1
29 United States-University of Tennessee . 1.0 3.3 2.9 3.0 10.2
30 Germany-FORSCHUNGSZENTRUM JULICH . . . . 0.2 0.2
31 United States-UNIV MASSACHUSETTS . . 5.0 4.9 1.1 11.0
32 United States-University of New Mexico 2.7 9.4 2.0 0.0 0.1 14.2
33 United States-University of Oklahoma . . 2.3 3.0 1.0 6.3
34 Switzerland-École Polytechnique Fédérale de Lausanne 0.0 . . 1.5 6.0 7.5
35 Germany-FORSCHUNGSZENTRUM ROSSENDORF EV . 2.0 6.2 1.5 . 9.7
36 Germany-ROSSENDORF INC . 7.2 1.8 2.0 . 10.9
37 United States-Washington University in St. Louis . 0.0 . 2.0 6.5 8.5
38 United States-Georgia Institute of Technology 0.0 0.5 0.0 1.5 3.0 5.0
39 Russian Federation-NI LOBACHEVSKII STATE UNIV 0.0 0.0 0.0 0.0 0.0 0.0
40 Taiwan-National Central University . . 0.0 0.2 1.0 1.2
41 United States-University of Wisconsin - Madison 0.0 0.0 3.5 2.0 0.0 5.5
42 Taiwan-ACADEMIA SINICA - TAIWAN . . 0.0 0.2 1.0 1.2
43 Germany-Karlsruhe Institute of Technology 1.5 1.0 0.5 0.0 0.0 3.0
44 United States-LAWRENCE BERKELEY NATL LAB . . 4.0 1.4 2.0 7.4
45 United States-SANDIA NATL LABS . 0.5 2.0 2.0 0.7 5.2
46 Australia-AUSTRALIAN NUCL SCI & TECHNOL ORG 3.5 1.0 2.5 0.0 1.0 8.0
47 Russian Federation-SAMARA STATE UNIV 0.0 0.0 0.0 0.0 0.0 0.0
48 France-University of Paris-Sud 11 . 0.0 1.0 0.0 2.0 3.0
49 Germany-RWTH Aachen University . . . . 0.0 0.0
50 Korea, Republic of-KOREA ATOMIC ENERGY RESEARCH INSTITUTE . 0.3 0.3 0.0 0.6 1.2
51 Czech Republic-MASARYK UNIV . . 0.0 0.0 0.1 0.1
52 France-Univ Lille Nord France . . . . 10.2 10.2
53 Germany-Helmholtz Zentrum Dresden Rossendorf . . . . 2.5 2.5
54 United States-University of Georgia 1.0 2.7 1.3 0.0 0.0 5.0
55 United States-Oregon State University . . 3.3 1.0 0.0 4.3
56 United States-The University of Alabama . . 1.0 1.0 2.0 4.0
57 France-French National Centre for Scientific Research 0.5 0.0 0.0 1.0 0.0 1.5
58 Germany-Forschungszentrum Dresden Rossendorf . . . 2.0 0.3 2.3
59 India-BHABHA ATOM RES CTR 0.0 . 0.0 0.0 0.0 0.0
60 United States-Carnegie Institution . . 2.0 9.2 . 11.2
61 United States-MONTANA STATE UNIV . . 2.0 0.0 2.0 4.0
62 United States-University of Illinois at Urbana-Champaign . 2.0 0.0 1.0 1.0 4.0
63 Czech Republic-INST PHYS ASCR . . . . 0.1 0.1
64 United States-Stony Brook University, The State University of New York 1.0 . 2.5 0.0 0.0 3.5
65 United States-University of California, Davis . . 1.0 0.0 1.5 2.5
66 China-Jilin University . . 3.0 3.0 2.3 8.3
67 Russian Federation-Lomonosov Moscow State University 0.0 0.0 0.0 0.0 0.0 0.0
68 United States-Michigan State University . . . 2.5 3.0 5.5
69 United States-University of South Carolina . . . . 2.3 2.3
70 Czech Republic-Charles University in Prague . . 0.0 0.0 0.0 0.0
71 United States-COLORADO SCH MINES . 2.0 1.5 0.5 1.0 5.0
72 United States-Pennsylvania State University 0.0 . 0.0 2.4 0.0 2.4
73 United States-Princeton University . . 0.0 4.0 0.0 4.0
74 United States-University of Chicago 1.0 0.0 1.6 2.0 0.0 4.6
75 United States-University of Missouri 0.5 0.0 0.5 2.5 0.0 3.5
76 Australia-University of New South Wales 1.0 1.0 2.0 0.0 0.5 4.5
77 Austria-Innsbruck University . . 0.6 2.0 . 2.6
78 Belgium-University of Antwerp 0.0 0.0 . . . 0.0
79 Czech Republic-CZECH GEOL SURVEY . 0.0 0.0 0.0 0.1 0.1
80 France-University Pierre and Marie Curie 0.5 0.0 0.0 0.0 0.3 0.8
81 Germany-University of Jena . . . 1.0 0.0 1.0
82 United States-Clemson University . 0.8 0.3 0.4 0.0 1.6
83 Japan-University of Tokyo 0.0 2.0 0.0 1.0 0.0 3.0
84 Russian Federation-Lobachevskii Nizhni Novgorod State Univ . 0.0 0.0 . 0.0 0.0
85 Sweden-Royal Institute of Technology 2.0 . 0.0 0.0 0.0 2.0
86 China-Changchun Univ Sci & Technol . . . . 3.8 3.8
87 Spain-Universitat Politècnica de Catalunya 0.5 0.0 . 0.0 0.0 0.5
88 Switzerland-University of Basel . . 0.0 0.0 0.0 0.0
89 United States-Johns Hopkins University . . 1.0 0.4 0.0 1.4
90 United States-LAWRENCE BERKELEY LAB 0.0 . 0.7 1.0 . 1.7
91 United States-UNIV MINNESOTA . . . . 0.0 0.0
92 United States-University of Arizona . . . 0.0 0.0 0.0
93 Australia-Queensland University of Technology . . . 0.0 . 0.0
94 China-Lanzhou University . . 0.0 0.5 0.0 0.5
95 Italy-Sapienza University of Rome . . 0.0 2.4 0.5 3.0
96 Japan-TOHO UNIV . 0.0 0.0 0.0 0.0 0.0
97 United Kingdom-University of Bristol 0.0 . 0.0 2.0 0.3 2.3
98 United States-TEXAS A&M UNIV . 4.0 . 0.0 1.0 5.0
99 France-USTL . . 0.0 0.0 0.0 0.0
100 Germany-Helmholtz Zentrum Dresden Rossendorf eV . . . . 1.5 1.5
101 United Kingdom-BNFL . 0.0 0.8 1.0 . 1.8
102 United Kingdom-University of Leeds . . 0.0 0.0 0.0 0.0
103 United States-LAWRENCE LIVERMORE NATL LAB . 3.0 . 1.0 0.0 4.0
104 United States-Miami University . . . 3.0 0.0 3.0
105 United States-Savannah River Natl Lab . . . 0.0 0.0 0.0
106 United States-SLAC . . 0.0 1.5 0.5 2.0
107 United States-WESTINGHOUSE SAVANNAH RIVER CO . 0.5 2.3 0.0 . 2.8

Number of publications among 10% most cited in field, full counts


Bar chart of publication_year

Share of publications among 10% most cited in field, fractionalized (%)

Obs Organization 1990-1994 1995-1999 2000-2004 2005-2009 2010-2014 All years
1 All organizations 19.6 20.9 19.3 13.4 12.1 15.4
2 United States-University of Notre Dame . 15.7 15.5 9.3 10.5 11.9
3 United States-PACIFIC NW NATL LAB . 30.8 50.5 12.9 9.2 14.8
4 Russian Federation-Russian Academy of Sciences 0.0 0.0 0.0 7.8 1.4 2.6
5 United States-ARGONNE NATL LAB 50.0 53.1 35.7 12.8 22.7 28.6
6 United States-University of California, Berkeley . 62.2 37.2 7.9 12.6 18.6
7 United States-Stanford University 100.0 60.0 33.5 31.2 28.8 33.6
8 United States-OAK RIDGE NATL LAB 0.0 0.0 39.1 24.0 15.5 21.6
9 Russian Federation-Saint Petersburg State University . 0.0 4.7 5.3 0.0 2.8
10 France-Atomic Energy and Alternative Energies Commission . 72.7 9.4 19.4 34.0 26.6
11 Germany-Kiel University . . 50.7 0.0 5.0 8.1
12 United States-Auburn University . . 22.3 7.3 0.0 15.8
13 United States-United States Geological Survey 62.5 52.0 32.1 21.0 11.0 39.9
14 China-Chinese Academy of Sciences . 27.0 33.3 0.0 22.0 19.9
15 United Kingdom-University of Birmingham 8.0 3.8 0.0 0.0 0.0 3.0
16 United Kingdom-University of Oxford 23.2 37.2 21.2 25.0 . 25.7
17 Russian Federation-NIZHNII NOVGOROD STATE UNIV 0.0 0.0 0.0 0.0 0.0 0.0
18 United States-Florida State University 50.0 . 90.0 16.8 6.2 23.6
19 United States-George Washington University . 0.0 63.2 63.5 34.1 41.1
20 United Kingdom-University of Manchester . 0.0 30.0 8.4 6.8 10.3
21 Japan-Japan Atomic Energy Agency 67.9 11.2 0.0 0.0 0.0 9.1
22 Czech Republic-Natl Museum 0.0 31.9 0.0 0.0 0.4 6.6
23 United States-BROOKHAVEN NATL LAB 43.4 21.2 12.5 0.0 0.0 16.4
24 Russian Federation-NIZHNI NOVGOROD STATE UNIV . . 0.0 0.0 . 0.0
25 United States-Washington State University . 9.8 11.5 11.3 3.9 8.9
26 United States-LOS ALAMOS NATL LAB 60.0 78.6 12.5 8.1 16.1 23.7
27 Canada-University of Manitoba . 30.2 0.0 24.4 0.0 15.5
28 United States-University of Michigan . 32.6 10.3 2.6 13.9 12.8
29 United States-University of Tennessee . 35.3 88.4 21.6 18.5 29.1
30 Germany-FORSCHUNGSZENTRUM JULICH . . . . 0.9 0.9
31 United States-UNIV MASSACHUSETTS . . 39.7 52.0 6.5 34.8
32 United States-University of New Mexico 42.4 49.6 100.0 0.0 2.6 44.6
33 United States-University of Oklahoma . . 35.4 26.7 2.8 20.1
34 Switzerland-École Polytechnique Fédérale de Lausanne 0.0 . . 12.2 23.8 20.3
35 Germany-FORSCHUNGSZENTRUM ROSSENDORF EV . 52.9 39.3 14.3 . 29.0
36 Germany-ROSSENDORF INC . 48.6 17.6 42.9 . 36.0
37 United States-Washington University in St. Louis . 0.0 . 35.4 36.5 35.5
38 United States-Georgia Institute of Technology 0.0 50.0 0.0 24.4 32.7 24.3
39 Russian Federation-NI LOBACHEVSKII STATE UNIV 0.0 0.0 0.0 0.0 0.0 0.0
40 Taiwan-National Central University . . 0.0 1.7 8.1 5.1
41 United States-University of Wisconsin - Madison 0.0 0.0 91.2 10.5 0.0 15.1
42 Taiwan-ACADEMIA SINICA - TAIWAN . . 0.0 1.8 8.1 5.3
43 Germany-Karlsruhe Institute of Technology 62.5 66.7 6.0 0.0 0.0 15.5
44 United States-LAWRENCE BERKELEY NATL LAB . . 40.2 11.1 45.6 32.0
45 United States-SANDIA NATL LABS . 25.0 35.7 61.0 3.5 25.7
46 Australia-AUSTRALIAN NUCL SCI & TECHNOL ORG 71.9 20.0 24.7 0.0 19.8 31.1
47 Russian Federation-SAMARA STATE UNIV 0.0 0.0 0.0 0.0 0.0 0.0
48 France-University of Paris-Sud 11 . 0.0 35.7 0.0 21.4 12.4
49 Germany-RWTH Aachen University . . . . 0.0 0.0
50 Korea, Republic of-KOREA ATOMIC ENERGY RESEARCH INSTITUTE . 33.3 4.2 0.0 3.2 4.8
51 Czech Republic-MASARYK UNIV . . 0.0 0.0 0.5 0.4
52 France-Univ Lille Nord France . . . . 51.4 51.4
53 Germany-Helmholtz Zentrum Dresden Rossendorf . . . . 6.0 6.0
54 United States-University of Georgia 100.0 50.0 18.3 0.0 0.0 32.6
55 United States-Oregon State University . . 55.6 22.5 0.0 21.9
56 United States-The University of Alabama . . 66.7 40.0 16.8 26.2
57 France-French National Centre for Scientific Research 50.0 0.0 0.0 20.5 0.0 12.2
58 Germany-Forschungszentrum Dresden Rossendorf . . . 14.3 7.4 11.6
59 India-BHABHA ATOM RES CTR 0.0 . 0.0 0.0 0.0 0.0
60 United States-Carnegie Institution . . 80.0 68.1 . 70.1
61 United States-MONTANA STATE UNIV . . 42.9 0.0 9.7 16.1
62 United States-University of Illinois at Urbana-Champaign . 33.3 0.0 6.9 14.3 15.3
63 Czech Republic-INST PHYS ASCR . . . . 0.5 0.5
64 United States-Stony Brook University, The State University of New York 100.0 . 24.5 0.0 0.0 14.2
65 United States-University of California, Davis . . 100.0 0.0 14.1 16.5
66 China-Jilin University . . 100.0 55.6 32.0 61.9
67 Russian Federation-Lomonosov Moscow State University 0.0 0.0 0.0 0.0 0.0 0.0
68 United States-Michigan State University . . . 50.8 26.5 32.6
69 United States-University of South Carolina . . . . 19.8 19.8
70 Czech Republic-Charles University in Prague . . 0.0 0.0 0.0 0.0
71 United States-COLORADO SCH MINES . 60.0 50.0 6.9 11.5 38.1
72 United States-Pennsylvania State University 0.0 . 0.0 17.6 0.0 8.8
73 United States-Princeton University . . 0.0 63.3 0.0 32.9
74 United States-University of Chicago 100.0 0.0 38.2 30.6 0.0 33.4
75 United States-University of Missouri 21.4 0.0 27.3 28.0 0.0 24.4
76 Australia-University of New South Wales 100.0 25.0 66.7 0.0 15.2 32.9
77 Austria-Innsbruck University . . 15.7 14.3 . 14.5
78 Belgium-University of Antwerp 0.0 0.0 . . . 0.0
79 Czech Republic-CZECH GEOL SURVEY . 0.0 0.0 0.0 1.5 0.6
80 France-University Pierre and Marie Curie 16.7 0.0 0.0 0.0 8.9 10.6
81 Germany-University of Jena . . . 8.3 0.0 3.7
82 United States-Clemson University . 22.7 6.7 22.4 0.0 12.3
83 Japan-University of Tokyo 0.0 75.0 0.0 51.7 0.0 38.3
84 Russian Federation-Lobachevskii Nizhni Novgorod State Univ . 0.0 0.0 . 0.0 0.0
85 Sweden-Royal Institute of Technology 72.2 . 0.0 0.0 0.0 18.6
86 China-Changchun Univ Sci & Technol . . . . 29.7 29.7
87 Spain-Universitat Politècnica de Catalunya 16.7 0.0 . 0.0 0.0 4.6
88 Switzerland-University of Basel . . 0.0 0.0 0.0 0.0
89 United States-Johns Hopkins University . . 71.4 2.4 0.0 10.9
90 United States-LAWRENCE BERKELEY LAB 0.0 . 16.7 11.0 . 11.4
91 United States-UNIV MINNESOTA . . . . 0.0 0.0
92 United States-University of Arizona . . . 0.0 0.0 0.0
93 Australia-Queensland University of Technology . . . 0.0 . 0.0
94 China-Lanzhou University . . 0.0 12.5 0.0 5.4
95 Italy-Sapienza University of Rome . . 0.0 50.0 30.0 33.9
96 Japan-TOHO UNIV . 0.0 0.0 0.0 0.0 0.0
97 United Kingdom-University of Bristol 0.0 . 0.0 30.0 11.1 22.7
98 United States-TEXAS A&M UNIV . 67.7 . 0.0 58.8 62.5
99 France-USTL . . 0.0 0.0 0.0 0.0
100 Germany-Helmholtz Zentrum Dresden Rossendorf eV . . . . 10.9 10.9
101 United Kingdom-BNFL . 0.0 12.2 50.0 . 21.5
102 United Kingdom-University of Leeds . . 0.0 0.0 0.0 0.0
103 United States-LAWRENCE LIVERMORE NATL LAB . 66.7 . 66.7 0.0 44.4
104 United States-Miami University . . . 37.9 0.0 29.0
105 United States-Savannah River Natl Lab . . . 0.0 0.0 0.0
106 United States-SLAC . . 0.0 48.8 10.0 25.4
107 United States-WESTINGHOUSE SAVANNAH RIVER CO . 50.0 57.9 0.0 . 42.0

Share of publications among 10% most cited in field, fractionalized (%)


Bar chart of publication_year

Field normalized citation rate (cf), fractionalized

Obs Organization 1990-1994 1995-1999 2000-2004 2005-2009 2010-2014 All years
1 All organizations 1.74 1.64 1.42 1.53 1.19 1.42
2 United States-University of Notre Dame . 1.88 1.24 1.43 1.40 1.38
3 United States-PACIFIC NW NATL LAB . 1.77 2.57 1.13 1.11 1.26
4 Russian Federation-Russian Academy of Sciences 0.43 0.37 0.25 0.64 0.40 0.42
5 United States-ARGONNE NATL LAB 10.40 5.16 2.42 1.72 1.57 2.74
6 United States-University of California, Berkeley . 3.76 2.10 1.05 1.13 1.42
7 United States-Stanford University 7.50 2.74 2.44 2.55 2.15 2.50
8 United States-OAK RIDGE NATL LAB 0.41 0.74 2.09 1.54 1.32 1.47
9 Russian Federation-Saint Petersburg State University . 0.05 1.09 0.70 0.35 0.60
10 France-Atomic Energy and Alternative Energies Commission . 5.46 1.38 1.92 2.42 2.19
11 Germany-Kiel University . . 1.59 0.60 0.99 0.94
12 United States-Auburn University . . 1.49 1.15 0.93 1.34
13 United States-United States Geological Survey 6.96 3.60 2.33 1.26 1.25 3.56
14 China-Chinese Academy of Sciences . 2.30 1.45 0.50 1.50 1.42
15 United Kingdom-University of Birmingham 1.18 0.67 0.59 0.69 0.68 0.71
16 United Kingdom-University of Oxford 1.13 2.20 1.74 1.51 . 1.64
17 Russian Federation-NIZHNII NOVGOROD STATE UNIV 0.00 0.05 0.06 0.16 0.02 0.09
18 United States-Florida State University 1.88 . 4.85 1.43 0.58 1.54
19 United States-George Washington University . 0.47 3.29 5.80 2.21 3.03
20 United Kingdom-University of Manchester . 0.34 2.12 1.06 1.48 1.41
21 Japan-Japan Atomic Energy Agency 5.03 1.07 0.61 0.26 0.88 1.09
22 Czech Republic-Natl Museum 0.11 1.05 0.47 0.26 0.68 0.57
23 United States-BROOKHAVEN NATL LAB 3.47 1.78 1.31 0.83 0.73 1.71
24 Russian Federation-NIZHNI NOVGOROD STATE UNIV . . 0.04 0.09 . 0.05
25 United States-Washington State University . 0.83 1.08 1.22 0.81 1.01
26 United States-LOS ALAMOS NATL LAB 2.81 3.10 1.36 1.35 1.20 1.68
27 Canada-University of Manitoba . 2.10 0.82 1.13 0.51 1.19
28 United States-University of Michigan . 2.15 0.95 0.80 1.54 1.35
29 United States-University of Tennessee . 1.68 6.32 1.29 1.43 1.86
30 Germany-FORSCHUNGSZENTRUM JULICH . . . . 0.63 0.63
31 United States-UNIV MASSACHUSETTS . . 2.90 2.24 1.36 2.46
32 United States-University of New Mexico 6.70 3.01 2.60 0.26 0.49 3.71
33 United States-University of Oklahoma . . 3.06 1.46 0.68 1.49
34 Switzerland-École Polytechnique Fédérale de Lausanne 0.22 . . 1.30 1.59 1.48
35 Germany-FORSCHUNGSZENTRUM ROSSENDORF EV . 2.78 3.74 1.60 . 2.58
36 Germany-ROSSENDORF INC . 3.90 1.53 1.54 . 2.78
37 United States-Washington University in St. Louis . 2.05 . 1.85 1.97 1.94
38 United States-Georgia Institute of Technology 0.40 3.73 1.22 1.70 2.04 1.79
39 Russian Federation-NI LOBACHEVSKII STATE UNIV 0.02 0.07 0.05 0.43 0.00 0.06
40 Taiwan-National Central University . . 1.35 1.36 1.16 1.25
41 United States-University of Wisconsin - Madison 0.39 2.04 3.96 1.12 0.54 1.29
42 Taiwan-ACADEMIA SINICA - TAIWAN . . 1.35 1.42 1.16 1.27
43 Germany-Karlsruhe Institute of Technology 3.58 3.23 1.10 0.84 0.74 1.44
44 United States-LAWRENCE BERKELEY NATL LAB . . 2.63 0.99 1.95 1.87
45 United States-SANDIA NATL LABS . 1.43 1.96 1.96 1.17 1.53
46 Australia-AUSTRALIAN NUCL SCI & TECHNOL ORG 6.06 2.56 1.41 0.64 1.11 2.51
47 Russian Federation-SAMARA STATE UNIV 0.04 0.14 0.34 0.31 0.24 0.20
48 France-University of Paris-Sud 11 . 0.25 2.06 0.96 0.80 1.02
49 Germany-RWTH Aachen University . . . . 0.59 0.59
50 Korea, Republic of-KOREA ATOMIC ENERGY RESEARCH INSTITUTE . 1.54 1.07 0.41 0.56 0.73
51 Czech Republic-MASARYK UNIV . . 0.08 0.30 0.81 0.70
52 France-Univ Lille Nord France . . . . 3.45 3.45
53 Germany-Helmholtz Zentrum Dresden Rossendorf . . . . 1.01 1.01
54 United States-University of Georgia 4.70 3.01 1.64 0.41 0.26 2.15
55 United States-Oregon State University . . 3.79 1.31 0.94 1.81
56 United States-The University of Alabama . . 2.28 2.02 1.42 1.61
57 France-French National Centre for Scientific Research 4.02 0.67 0.10 1.60 0.79 1.25
58 Germany-Forschungszentrum Dresden Rossendorf . . . 1.13 1.18 1.15
59 India-BHABHA ATOM RES CTR 1.01 . 0.16 0.33 0.48 0.42
60 United States-Carnegie Institution . . 3.65 6.92 . 6.36
61 United States-MONTANA STATE UNIV . . 1.80 0.56 1.22 1.18
62 United States-University of Illinois at Urbana-Champaign . 2.47 1.09 1.34 1.98 1.78
63 Czech Republic-INST PHYS ASCR . . . . 0.76 0.76
64 United States-Stony Brook University, The State University of New York 5.89 . 1.41 0.74 1.31 1.28
65 United States-University of California, Davis . . 7.33 0.89 1.54 1.80
66 China-Jilin University . . 4.86 3.76 2.40 3.70
67 Russian Federation-Lomonosov Moscow State University 0.47 1.56 0.16 0.14 0.41 0.51
68 United States-Michigan State University . . . 2.40 1.62 1.82
69 United States-University of South Carolina . . . . 0.99 0.99
70 Czech Republic-Charles University in Prague . . 0.28 0.17 0.58 0.40
71 United States-COLORADO SCH MINES . 3.43 2.76 1.20 1.00 2.37
72 United States-Pennsylvania State University 0.84 . 1.79 1.56 0.81 1.22
73 United States-Princeton University . . 0.58 2.45 0.32 1.46
74 United States-University of Chicago 4.70 2.05 1.67 45.50 0.79 25.73
75 United States-University of Missouri 2.23 0.64 1.37 1.36 0.79 1.36
76 Australia-University of New South Wales 6.15 3.29 2.91 1.18 1.11 2.45
77 Austria-Innsbruck University . . 1.17 1.00 . 1.02
78 Belgium-University of Antwerp 0.73 0.60 . . . 0.65
79 Czech Republic-CZECH GEOL SURVEY . 0.23 0.44 0.52 0.80 0.57
80 France-University Pierre and Marie Curie 1.10 1.60 0.89 1.25 1.13 1.14
81 Germany-University of Jena . . . 0.61 0.62 0.61
82 United States-Clemson University . 1.61 0.79 1.35 1.15 1.22
83 Japan-University of Tokyo 0.06 5.61 0.47 1.81 0.65 2.41
84 Russian Federation-Lobachevskii Nizhni Novgorod State Univ . 0.00 0.04 . 0.00 0.02
85 Sweden-Royal Institute of Technology 3.83 . 1.00 1.08 0.90 1.71
86 China-Changchun Univ Sci & Technol . . . . 1.94 1.94
87 Spain-Universitat Politècnica de Catalunya 1.49 1.71 . 1.41 0.35 1.23
88 Switzerland-University of Basel . . 0.93 0.44 1.21 0.61
89 United States-Johns Hopkins University . . 2.47 1.03 0.75 1.16
90 United States-LAWRENCE BERKELEY LAB 0.34 . 1.44 1.42 . 1.31
91 United States-UNIV MINNESOTA . . . . 1.01 1.01
92 United States-University of Arizona . . . 0.73 0.45 0.52
93 Australia-Queensland University of Technology . . . 0.38 . 0.38
94 China-Lanzhou University . . 1.29 0.92 0.60 0.81
95 Italy-Sapienza University of Rome . . 0.81 2.60 2.90 2.26
96 Japan-TOHO UNIV . 0.43 0.21 0.33 0.34 0.32
97 United Kingdom-University of Bristol 1.52 . 0.32 1.91 1.00 1.63
98 United States-TEXAS A&M UNIV . 2.74 . 1.75 2.84 2.68
99 France-USTL . . 1.21 0.38 0.89 0.87
100 Germany-Helmholtz Zentrum Dresden Rossendorf eV . . . . 1.10 1.10
101 United Kingdom-BNFL . 0.07 1.36 2.33 . 1.45
102 United Kingdom-University of Leeds . . 0.60 0.29 0.70 0.63
103 United States-LAWRENCE LIVERMORE NATL LAB . 3.41 . 1.71 0.55 2.03
104 United States-Miami University . . . 2.28 1.00 1.98
105 United States-Savannah River Natl Lab . . . 0.46 0.62 0.60
106 United States-SLAC . . 1.68 2.70 1.01 1.76
107 United States-WESTINGHOUSE SAVANNAH RIVER CO . 3.73 3.08 0.71 . 2.48

Field normalized citation rate (cf), fractionalized


Bar chart of publication_year