Lev3: JOURNAL OF ENVIRONMENTAL RADIOACTIVITY//HEALTH PHYSICS//RADON - Statistics for Countries

Statistics per Country

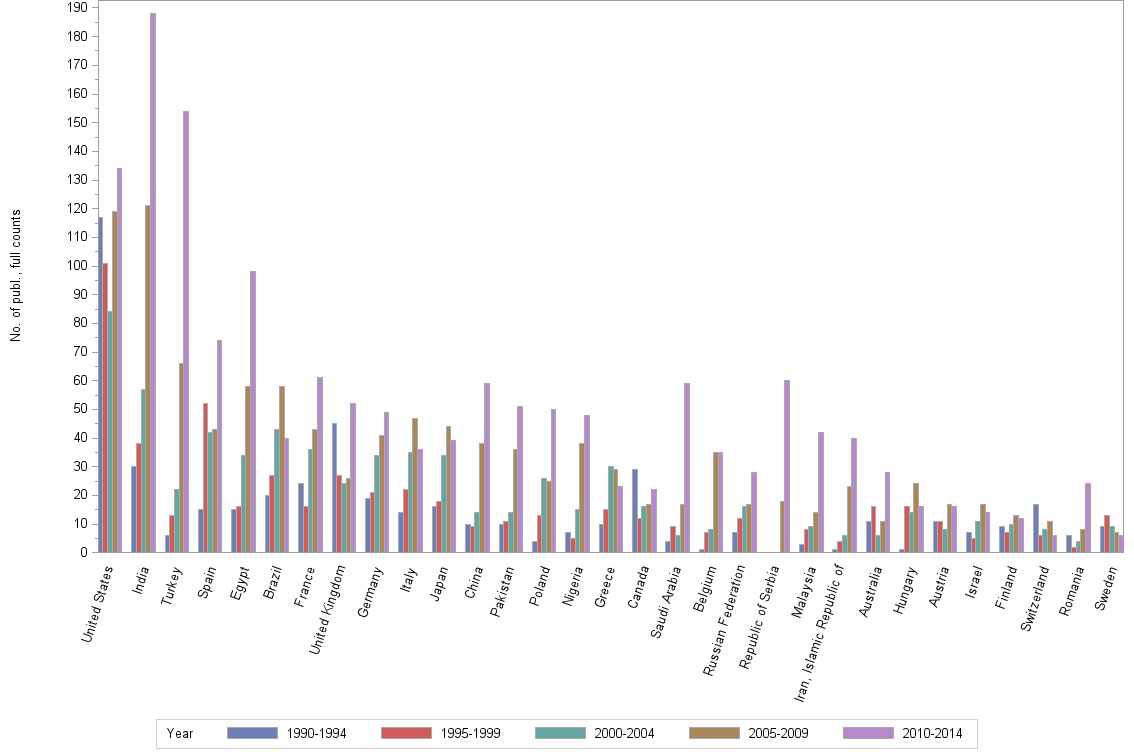
Number of publications, full counts

Obs Country 1990-1994 1995-1999 2000-2004 2005-2009 2010-2014 All years
1 All countries 505 609 690 1075 1570 4449
2 United States 117 101 84 119 134 555
3 India 30 38 57 121 188 434
4 Turkey 6 13 22 66 154 261
5 Spain 15 52 42 43 74 226
6 Egypt 15 16 34 58 98 221
7 Brazil 20 27 43 58 40 188
8 France 24 16 36 43 61 180
9 United Kingdom 45 27 24 26 52 174
10 Germany 19 21 34 41 49 164
11 Italy 14 22 35 47 36 154
12 Japan 16 18 34 44 39 151
13 China 10 9 14 38 59 130
14 Pakistan 10 11 14 36 51 122
15 Poland 4 13 26 25 50 118
16 Nigeria 7 5 15 38 48 113
17 Greece 10 15 30 29 23 107
18 Canada 29 12 16 17 22 96
19 Saudi Arabia 4 9 6 17 59 95
20 Belgium 1 7 8 35 35 86
21 Russian Federation 7 12 16 17 28 80
22 Republic of Serbia . . . 18 60 78
23 Malaysia 3 8 9 14 42 76
24 Iran, Islamic Republic of 1 4 6 23 40 74
25 Australia 11 16 6 11 28 72
26 Hungary 1 16 14 24 16 71
27 Austria 11 11 8 17 16 63
28 Israel 7 5 11 17 14 54
29 Finland 9 7 10 13 12 51
30 Switzerland 17 6 8 11 6 48
31 Romania 6 2 4 8 24 44
32 Sweden 9 13 9 7 6 44
33 Korea, Republic of 1 2 7 12 20 42
34 Syrian Arab Republic 7 8 6 8 11 40
35 Cyprus . . 6 10 22 38
36 Mexico 3 3 6 11 14 37
37 Czech Republic . 4 4 11 15 34
38 Bangladesh 2 10 8 2 11 33
39 Netherlands 5 6 6 9 7 33
40 Taiwan 6 7 3 8 9 33
41 Hong Kong 12 16 . . . 28
42 Jordan . 2 5 11 10 28
43 Slovenia . 4 5 1 18 28
44 Sudan 2 6 5 3 8 24
45 Croatia . 7 2 6 7 22
46 Yugoslavia 7 10 1 1 . 19
47 Norway 2 3 2 2 8 17
48 Ghana . . 1 1 14 16
49 Portugal 1 1 1 1 12 16
50 Algeria 1 5 4 2 3 15
51 Tunisia . . 1 8 6 15

Number of publications, full counts


Bar chart of publication_year

Share of the total number of publications in the field, full counts (%)

Obs Country 1990-1994 1995-1999 2000-2004 2005-2009 2010-2014 All years
1 All countries 100.0 100.0 100.0 100.0 100.0 100.0
2 United States 23.2 16.6 12.2 11.1 8.5 12.5
3 India 5.9 6.2 8.3 11.3 12.0 9.8
4 Turkey 1.2 2.1 3.2 6.1 9.8 5.9
5 Spain 3.0 8.5 6.1 4.0 4.7 5.1
6 Egypt 3.0 2.6 4.9 5.4 6.2 5.0
7 Brazil 4.0 4.4 6.2 5.4 2.5 4.2
8 France 4.8 2.6 5.2 4.0 3.9 4.0
9 United Kingdom 8.9 4.4 3.5 2.4 3.3 3.9
10 Germany 3.8 3.4 4.9 3.8 3.1 3.7
11 Italy 2.8 3.6 5.1 4.4 2.3 3.5
12 Japan 3.2 3.0 4.9 4.1 2.5 3.4
13 China 2.0 1.5 2.0 3.5 3.8 2.9
14 Pakistan 2.0 1.8 2.0 3.3 3.2 2.7
15 Poland 0.8 2.1 3.8 2.3 3.2 2.7
16 Nigeria 1.4 0.8 2.2 3.5 3.1 2.5
17 Greece 2.0 2.5 4.3 2.7 1.5 2.4
18 Canada 5.7 2.0 2.3 1.6 1.4 2.2
19 Saudi Arabia 0.8 1.5 0.9 1.6 3.8 2.1
20 Belgium 0.2 1.1 1.2 3.3 2.2 1.9
21 Russian Federation 1.4 2.0 2.3 1.6 1.8 1.8
22 Republic of Serbia . . . 1.7 3.8 1.8
23 Malaysia 0.6 1.3 1.3 1.3 2.7 1.7
24 Iran, Islamic Republic of 0.2 0.7 0.9 2.1 2.5 1.7
25 Australia 2.2 2.6 0.9 1.0 1.8 1.6
26 Hungary 0.2 2.6 2.0 2.2 1.0 1.6
27 Austria 2.2 1.8 1.2 1.6 1.0 1.4
28 Israel 1.4 0.8 1.6 1.6 0.9 1.2
29 Finland 1.8 1.1 1.4 1.2 0.8 1.1
30 Switzerland 3.4 1.0 1.2 1.0 0.4 1.1
31 Romania 1.2 0.3 0.6 0.7 1.5 1.0
32 Sweden 1.8 2.1 1.3 0.7 0.4 1.0
33 Korea, Republic of 0.2 0.3 1.0 1.1 1.3 0.9
34 Syrian Arab Republic 1.4 1.3 0.9 0.7 0.7 0.9
35 Cyprus . . 0.9 0.9 1.4 0.9
36 Mexico 0.6 0.5 0.9 1.0 0.9 0.8
37 Czech Republic . 0.7 0.6 1.0 1.0 0.8
38 Bangladesh 0.4 1.6 1.2 0.2 0.7 0.7
39 Netherlands 1.0 1.0 0.9 0.8 0.4 0.7
40 Taiwan 1.2 1.1 0.4 0.7 0.6 0.7
41 Hong Kong 2.4 2.6 . . . 0.6
42 Jordan . 0.3 0.7 1.0 0.6 0.6
43 Slovenia . 0.7 0.7 0.1 1.1 0.6
44 Sudan 0.4 1.0 0.7 0.3 0.5 0.5
45 Croatia . 1.1 0.3 0.6 0.4 0.5
46 Yugoslavia 1.4 1.6 0.1 0.1 . 0.4
47 Norway 0.4 0.5 0.3 0.2 0.5 0.4
48 Ghana . . 0.1 0.1 0.9 0.4
49 Portugal 0.2 0.2 0.1 0.1 0.8 0.4
50 Algeria 0.2 0.8 0.6 0.2 0.2 0.3
51 Tunisia . . 0.1 0.7 0.4 0.3

Share of the total number of publications in the field, full counts (%)


Bar chart of publication_year

Number of publications among 10% most cited in field, full counts

Obs Country 1990-1994 1995-1999 2000-2004 2005-2009 2010-2014 All years
1 All countries 34.7 31.3 41.5 74.6 71.6 253.6
2 United States 10.1 5.7 3.9 5.7 19.4 44.8
3 India 3.0 1.8 7.2 4.8 6.8 23.6
4 Turkey 0.3 0.0 1.3 13.4 7.2 22.2
5 Spain 2.0 4.5 1.9 2.0 1.0 11.3
6 Egypt 1.4 2.7 3.6 5.2 4.6 17.5
7 Brazil 0.6 0.9 1.3 5.0 0.6 8.5
8 France 0.8 0.0 1.3 4.3 9.1 15.4
9 United Kingdom 3.8 0.6 1.2 1.9 4.9 12.2
10 Germany 1.2 2.3 2.7 3.2 6.1 15.3
11 Italy 1.5 1.3 2.0 3.0 1.4 9.1
12 Japan 0.0 1.3 1.0 2.3 1.8 6.4
13 China 1.0 0.1 0.3 3.4 1.3 6.2
14 Pakistan 1.5 1.6 0.3 6.4 1.7 11.6
15 Poland 0.0 0.6 0.3 1.3 1.0 3.3
16 Nigeria 0.5 0.0 0.3 0.4 0.0 1.2
17 Greece 0.8 0.3 1.6 3.3 0.0 5.9
18 Canada 2.0 0.1 1.0 0.0 1.0 4.1
19 Saudi Arabia 0.0 0.0 1.0 1.3 3.4 5.7
20 Belgium 0.0 1.0 0.0 2.8 3.8 7.6
21 Russian Federation 0.0 0.0 0.0 1.0 1.2 2.2
22 Republic of Serbia . . . 3.0 2.0 5.0
23 Malaysia 0.0 0.3 0.3 0.5 0.5 1.7
24 Iran, Islamic Republic of 0.0 0.7 1.0 0.3 1.1 3.0
25 Australia 1.3 0.3 0.7 2.5 5.6 10.3
26 Hungary 0.0 0.3 1.0 3.9 1.0 6.2
27 Austria 0.5 1.5 0.0 0.6 2.5 5.2
28 Israel 0.0 0.0 0.3 0.4 0.0 0.7
29 Finland 0.0 0.3 0.0 0.3 0.0 0.6
30 Switzerland 0.0 0.0 0.3 2.4 0.0 2.7
31 Romania 0.0 0.0 0.3 1.0 0.8 2.1
32 Sweden 0.0 0.0 0.3 0.8 0.0 1.1
33 Korea, Republic of 0.3 0.3 0.3 0.0 0.5 1.4
34 Syrian Arab Republic 0.3 0.0 0.0 0.9 0.0 1.2
35 Cyprus . . 3.6 1.0 0.3 4.9
36 Mexico 0.0 0.0 0.4 0.0 0.0 0.4
37 Czech Republic . 0.0 0.0 0.0 0.3 0.3
38 Bangladesh 0.0 1.9 0.2 0.0 0.0 2.2
39 Netherlands 0.5 0.0 0.3 0.0 0.0 0.8
40 Taiwan 0.5 0.0 0.0 0.0 0.3 0.8
41 Hong Kong 2.6 0.3 . . . 2.9
42 Jordan . 1.3 2.0 1.0 1.4 5.7
43 Slovenia . 0.3 0.0 1.0 1.1 2.3
44 Sudan 0.0 0.0 0.0 0.0 0.7 0.7
45 Croatia . 0.0 0.0 0.1 0.0 0.1
46 Yugoslavia 0.9 0.0 0.0 0.0 . 0.9
47 Norway 0.0 0.0 0.0 0.0 0.0 0.0
48 Ghana . . 0.0 0.0 0.3 0.3
49 Portugal 0.0 0.0 0.0 0.0 0.0 0.0
50 Algeria 0.0 0.3 1.3 0.0 0.0 1.7
51 Tunisia . . 0.0 0.0 1.0 1.0

Number of publications among 10% most cited in field, full counts


Bar chart of publication_year

Share of publications among 10% most cited in field, fractionalized (%)

Obs Country 1990-1994 1995-1999 2000-2004 2005-2009 2010-2014 All years
1 All countries 6.9 5.1 6.0 6.9 4.6 5.7
2 United States 8.4 5.9 4.1 3.5 11.8 7.0
3 India 8.8 4.7 12.7 3.7 3.8 5.4
4 Turkey 2.4 0.0 6.2 20.7 4.8 8.6
5 Spain 14.9 8.7 4.6 4.9 1.6 5.4
6 Egypt 10.5 14.6 10.9 8.5 4.2 7.8
7 Brazil 4.2 1.9 2.9 9.0 1.7 4.6
8 France 2.8 0.0 2.6 10.7 15.1 8.1
9 United Kingdom 8.7 2.9 5.8 7.7 8.1 7.0
10 Germany 3.2 12.3 8.3 7.5 10.3 8.7
11 Italy 10.7 5.2 6.4 5.8 3.4 5.8
12 Japan 0.0 7.3 3.4 3.2 4.5 3.7
13 China 7.8 1.0 2.6 6.4 2.3 3.8
14 Pakistan 15.0 10.7 2.4 18.8 3.5 9.4
15 Poland 0.0 3.3 1.3 6.5 2.2 2.8
16 Nigeria 7.1 0.0 1.7 1.2 0.0 1.1
17 Greece 7.6 1.7 5.0 10.7 0.0 5.4
18 Canada 7.5 0.5 4.6 0.0 6.0 4.5
19 Saudi Arabia 0.0 0.0 16.7 5.9 4.1 4.7
20 Belgium 0.0 17.1 0.0 4.5 8.5 6.8
21 Russian Federation 0.0 0.0 0.0 1.6 1.3 0.8
22 Republic of Serbia . . . 15.8 3.5 6.3
23 Malaysia 0.0 4.2 3.9 3.4 1.4 2.5
24 Iran, Islamic Republic of 0.0 16.7 7.0 1.1 2.7 3.3
25 Australia 11.9 2.3 10.2 24.7 13.7 11.6
26 Hungary 0.0 2.2 7.3 15.7 7.4 8.7
27 Austria 4.8 17.0 0.4 2.5 15.2 7.9
28 Israel 0.0 0.0 3.4 0.9 0.2 1.1
29 Finland 0.0 5.1 0.0 2.4 0.0 1.4
30 Switzerland 0.0 0.0 7.2 18.3 0.0 4.6
31 Romania 0.0 0.0 12.9 7.7 3.4 4.0
32 Sweden 0.0 0.0 3.8 13.1 0.0 3.0
33 Korea, Republic of 33.3 16.7 4.4 0.0 1.4 2.6
34 Syrian Arab Republic 5.8 0.0 0.0 11.6 0.0 3.4
35 Cyprus . . 59.7 10.0 1.5 13.2
36 Mexico 0.0 0.0 9.5 0.0 0.0 1.4
37 Czech Republic . 0.0 0.0 0.0 2.4 1.1
38 Bangladesh 0.0 19.2 3.2 0.0 0.0 7.0
39 Netherlands 13.5 0.0 3.0 0.0 0.0 2.6
40 Taiwan 8.3 0.0 0.0 0.0 3.7 2.6
41 Hong Kong 21.0 2.0 . . . 9.9
42 Jordan . 40.0 40.0 12.0 11.2 19.3
43 Slovenia . 7.1 0.0 100.0 7.8 9.0
44 Sudan 0.0 0.0 0.0 0.0 7.8 1.9
45 Croatia . 0.0 0.0 1.1 0.0 0.3
46 Yugoslavia 14.1 0.0 0.0 0.0 . 5.2
47 Norway 0.0 0.0 0.0 0.0 0.0 0.0
48 Ghana . . 0.0 0.0 2.6 2.3
49 Portugal 0.0 0.0 0.0 0.0 0.0 0.0
50 Algeria 0.0 7.8 33.3 0.0 0.0 12.1
51 Tunisia . . 0.0 0.0 17.6 7.8

Share of publications among 10% most cited in field, fractionalized (%)


Bar chart of publication_year

Field normalized citation rate (cf), fractionalized

Obs Country 1990-1994 1995-1999 2000-2004 2005-2009 2010-2014 All years
1 All countries 0.73 0.73 0.80 0.84 0.64 0.74
2 United States 0.83 0.85 0.76 0.67 0.98 0.82
3 India 1.06 0.76 1.20 0.62 0.57 0.72
4 Turkey 0.54 0.45 0.84 1.69 0.74 0.97
5 Spain 1.24 0.98 0.80 0.77 0.57 0.80
6 Egypt 0.97 1.29 1.01 0.90 0.62 0.84
7 Brazil 0.55 0.46 0.70 1.05 0.52 0.73
8 France 0.52 0.71 0.94 0.90 1.03 0.87
9 United Kingdom 0.90 0.53 0.74 0.80 0.87 0.79
10 Germany 0.48 0.85 0.96 0.80 1.07 0.88
11 Italy 0.92 0.83 0.80 0.88 0.69 0.82
12 Japan 0.29 0.71 0.54 0.58 0.71 0.59
13 China 0.57 0.33 0.40 0.74 0.51 0.56
14 Pakistan 1.13 1.22 0.67 1.51 0.67 1.00
15 Poland 0.27 0.53 0.61 0.58 0.37 0.48
16 Nigeria 0.77 0.56 0.56 0.58 0.36 0.50
17 Greece 0.99 0.46 0.80 1.06 0.49 0.78
18 Canada 0.68 0.69 0.68 0.38 0.46 0.59
19 Saudi Arabia 0.23 0.36 1.27 0.78 0.51 0.58
20 Belgium 0.22 1.19 0.45 1.02 1.07 0.99
21 Russian Federation 0.15 0.13 0.36 0.19 0.19 0.21
22 Republic of Serbia . . . 1.15 0.57 0.70
23 Malaysia 0.18 0.59 0.60 0.77 0.45 0.55
24 Iran, Islamic Republic of 1.22 1.58 0.71 0.38 0.48 0.54
25 Australia 1.10 0.58 0.68 1.50 1.02 0.95
26 Hungary 0.22 0.48 0.73 1.37 0.96 0.92
27 Austria 0.72 1.33 0.87 0.96 1.22 1.02
28 Israel 0.46 0.16 0.80 0.63 0.54 0.59
29 Finland 0.75 0.85 0.50 0.58 0.41 0.61
30 Switzerland 0.57 0.58 1.10 1.33 0.45 0.78
31 Romania 0.24 0.05 0.77 0.89 0.49 0.51
32 Sweden 0.58 0.72 0.71 1.10 0.52 0.73
33 Korea, Republic of 1.84 1.55 0.65 0.54 0.41 0.56
34 Syrian Arab Republic 0.62 0.36 0.68 1.24 0.52 0.70
35 Cyprus . . 3.35 0.99 0.55 1.12
36 Mexico 0.65 0.55 0.85 0.37 0.44 0.51
37 Czech Republic . 0.06 0.55 0.22 0.44 0.33
38 Bangladesh 0.27 1.65 0.46 0.86 0.11 0.74
39 Netherlands 0.85 0.32 0.33 0.51 0.72 0.50
40 Taiwan 0.71 0.41 0.28 0.45 0.47 0.48
41 Hong Kong 1.22 0.50 . . . 0.80
42 Jordan . 1.94 2.07 1.63 0.88 1.47
43 Slovenia . 0.69 0.46 2.87 0.89 0.83
44 Sudan 0.18 0.86 0.36 0.51 0.78 0.62
45 Croatia . 0.44 0.19 0.44 0.46 0.42
46 Yugoslavia 0.86 0.45 0.34 0.16 . 0.58
47 Norway 0.06 0.75 0.38 0.33 0.33 0.42
48 Ghana . . 0.64 0.62 0.44 0.46
49 Portugal 0.39 1.00 0.69 0.19 0.31 0.35
50 Algeria 0.63 1.14 2.83 0.49 0.55 1.39
51 Tunisia . . 0.68 0.44 0.81 0.62

Field normalized citation rate (cf), fractionalized


Bar chart of publication_year