| All organizations |
176 |
259 |
243 |
298 |
350 |
1326 |
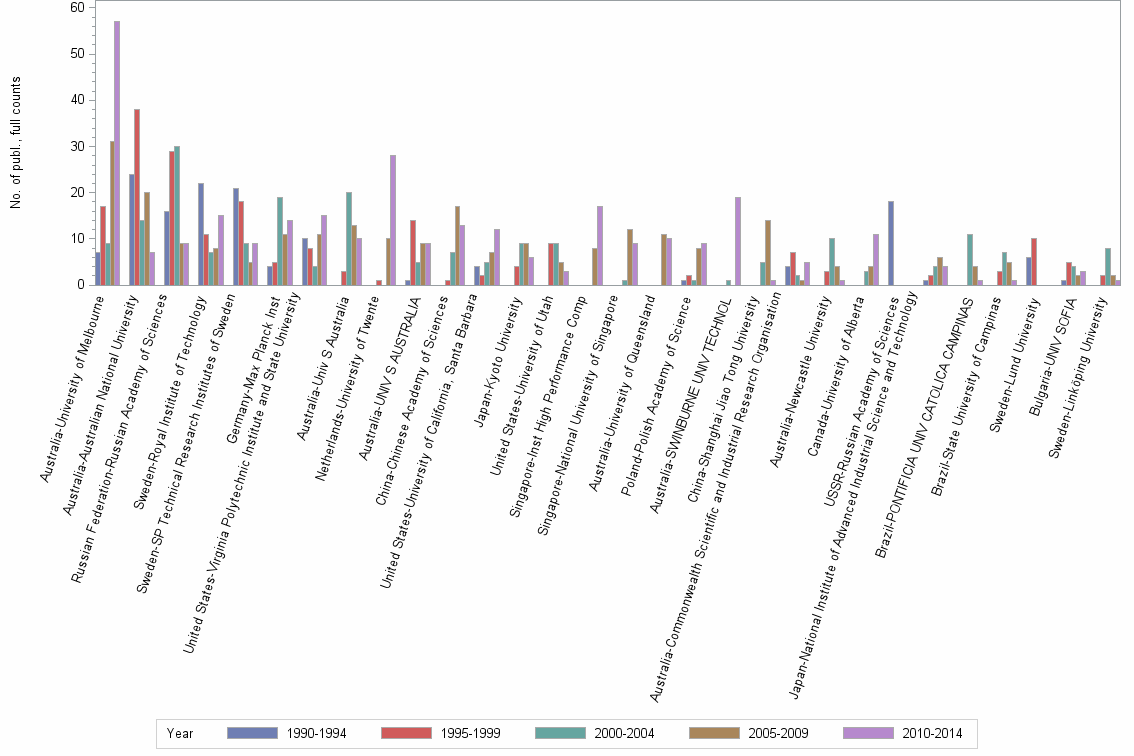
| Australia-University of Melbourne |
7 |
17 |
9 |
31 |
57 |
121 |
| Australia-Australian National University |
24 |
38 |
14 |
20 |
7 |
103 |
| Russian Federation-Russian Academy of Sciences |
16 |
29 |
30 |
9 |
9 |
93 |
| Sweden-Royal Institute of Technology |
22 |
11 |
7 |
8 |
15 |
63 |
| Sweden-SP Technical Research Institutes of Sweden |
21 |
18 |
9 |
5 |
9 |
62 |
| Germany-Max Planck Inst |
4 |
5 |
19 |
11 |
14 |
53 |
| United States-Virginia Polytechnic Institute and State University |
10 |
8 |
4 |
11 |
15 |
48 |
| Australia-Univ S Australia |
. |
3 |
20 |
13 |
10 |
46 |
| Netherlands-University of Twente |
. |
1 |
. |
10 |
28 |
39 |
| Australia-UNIV S AUSTRALIA |
1 |
14 |
5 |
9 |
9 |
38 |
| China-Chinese Academy of Sciences |
. |
1 |
7 |
17 |
13 |
38 |
| United States-University of California, Santa Barbara |
4 |
2 |
5 |
7 |
12 |
30 |
| Japan-Kyoto University |
. |
4 |
9 |
9 |
6 |
28 |
| United States-University of Utah |
. |
9 |
9 |
5 |
3 |
26 |
| Singapore-Inst High Performance Comp |
. |
. |
. |
8 |
17 |
25 |
| Singapore-National University of Singapore |
. |
. |
1 |
12 |
9 |
22 |
| Australia-University of Queensland |
. |
. |
. |
11 |
10 |
21 |
| Poland-Polish Academy of Science |
1 |
2 |
1 |
8 |
9 |
21 |
| Australia-SWINBURNE UNIV TECHNOL |
. |
. |
1 |
. |
19 |
20 |
| China-Shanghai Jiao Tong University |
. |
. |
5 |
14 |
1 |
20 |
| Australia-Commonwealth Scientific and Industrial Research Organisation |
4 |
7 |
2 |
1 |
5 |
19 |
| Australia-Newcastle University |
. |
3 |
10 |
4 |
1 |
18 |
| Canada-University of Alberta |
. |
. |
3 |
4 |
11 |
18 |
| USSR-Russian Academy of Sciences |
18 |
. |
. |
. |
. |
18 |
| Japan-National Institute of Advanced Industrial Science and Technology |
1 |
2 |
4 |
6 |
4 |
17 |
| Brazil-PONTIFICIA UNIV CATOLICA CAMPINAS |
. |
. |
11 |
4 |
1 |
16 |
| Brazil-State University of Campinas |
. |
3 |
7 |
5 |
1 |
16 |
| Sweden-Lund University |
6 |
10 |
. |
. |
. |
16 |
| Bulgaria-UNIV SOFIA |
1 |
5 |
4 |
2 |
3 |
15 |
| Sweden-Linköping University |
. |
2 |
8 |
2 |
1 |
13 |
| United States-UNIV TEXAS |
4 |
5 |
3 |
. |
. |
12 |
| China-East China Normal University |
. |
. |
. |
3 |
8 |
11 |
| United States-University of Illinois at Urbana-Champaign |
. |
4 |
2 |
3 |
1 |
10 |
| Japan-Tohoku University |
4 |
. |
3 |
. |
2 |
9 |
| Australia-Melbourne Ctr Nanofabricat |
. |
. |
. |
. |
8 |
8 |
| Australia-University of New South Wales |
2 |
3 |
. |
. |
3 |
8 |
| Australia-University of Sydney |
. |
4 |
1 |
2 |
1 |
8 |
| Bulgaria-BULGARIAN ACAD SCI |
1 |
1 |
2 |
2 |
2 |
8 |
| China-Harbin Institute of Technology |
. |
. |
. |
3 |
5 |
8 |
| Finland-Aalto University |
. |
. |
. |
2 |
6 |
8 |
| Israel-Weizmann Institute of Science |
. |
. |
1 |
5 |
2 |
8 |
| Japan-NATL INST MAT & CHEM RES |
. |
5 |
3 |
. |
. |
8 |
| Switzerland-ETH Zurich |
. |
4 |
1 |
2 |
1 |
8 |
| Ukraine-NATL ACAD SCI UKRAINE |
. |
. |
3 |
3 |
2 |
8 |
| United States-MICHIGAN TECHNOL UNIV |
. |
1 |
2 |
4 |
1 |
8 |
| Australia-MURDOCH UNIV |
. |
. |
. |
7 |
. |
7 |
| Brazil-Federal University of Viçosa |
. |
. |
7 |
. |
. |
7 |
| Germany-Johannes Gutenberg Univ Mainz |
. |
5 |
2 |
. |
. |
7 |
| Germany-University of Siegen |
. |
. |
1 |
. |
6 |
7 |
| Hungary-EOTVOS LORAND UNIV |
2 |
3 |
2 |
. |
. |
7 |
| Japan-Kyushu University |
3 |
. |
. |
3 |
1 |
7 |
| Russian Federation-State Technol Univ |
. |
. |
. |
2 |
5 |
7 |
| Switzerland-Omya Dev AG |
. |
. |
. |
2 |
5 |
7 |
| United Kingdom-University of Bristol |
3 |
1 |
1 |
1 |
1 |
7 |
| United States-Carnegie Mellon University |
. |
. |
5 |
2 |
. |
7 |
| United States-Ohio State University |
. |
. |
. |
3 |
4 |
7 |
| United States-University of Pennsylvania |
3 |
4 |
. |
. |
. |
7 |
| United States-University of Washington |
. |
2 |
3 |
1 |
1 |
7 |
| Australia-Monash University |
. |
. |
. |
2 |
4 |
6 |
| Brazil-UNICAMP |
. |
1 |
5 |
. |
. |
6 |
| Canada-McGill University |
. |
3 |
3 |
. |
. |
6 |
| Chile-Univ Concepcion |
. |
. |
. |
1 |
5 |
6 |
| China-BEIJING UNIV CHEM TECHNOL |
. |
1 |
. |
. |
5 |
6 |
| China-University of Science and Technology of China |
. |
. |
. |
5 |
1 |
6 |
| France-French National Centre for Scientific Research |
. |
. |
. |
3 |
3 |
6 |
| Japan-SHINSHU UNIVERSITY |
. |
. |
. |
1 |
5 |
6 |
| Japan-TOSHIBA |
2 |
4 |
. |
. |
. |
6 |
| Korea, Republic of-Pohang University of Science and Technology |
. |
. |
2 |
3 |
1 |
6 |
| New Zealand-VICTORIA UNIV WELLINGTON |
. |
2 |
1 |
3 |
. |
6 |
| Portugal-Technical University of Lisbon |
. |
. |
1 |
5 |
. |
6 |
| Singapore-Nanyang Technological University |
. |
. |
. |
. |
6 |
6 |
| United Kingdom-University College London |
. |
. |
1 |
. |
5 |
6 |
| United States-University of California, Berkeley |
. |
. |
1 |
3 |
2 |
6 |
| United States-University of Florida |
1 |
1 |
2 |
2 |
. |
6 |
| Australia-DEAKIN UNIV |
. |
. |
. |
. |
5 |
5 |
| China-Cent S Univ |
. |
. |
4 |
. |
1 |
5 |
| France-UNIV TOULOUSE |
. |
. |
. |
. |
5 |
5 |
| France-University Pierre and Marie Curie |
1 |
. |
. |
2 |
2 |
5 |
| Germany-INST POLYMER RES DRESDEN |
. |
4 |
. |
1 |
. |
5 |
| Germany-Technische Universität München |
1 |
1 |
1 |
1 |
1 |
5 |
| Germany-TU BERGAKAD FREIBERG |
. |
1 |
2 |
1 |
1 |
5 |
| Germany-UNIV ESSEN GESAMTHSCH |
4 |
1 |
. |
. |
. |
5 |
| Japan-Tokyo Institute of Technology |
1 |
2 |
1 |
. |
1 |
5 |
| Japan-University of Tokyo |
. |
. |
. |
2 |
3 |
5 |
| Korea, Republic of-Seoul Natl Univ Sci & Technol |
. |
. |
. |
. |
5 |
5 |
| Russian Federation-Russian Acad Agr Sci |
. |
4 |
1 |
. |
. |
5 |
| Russian Federation-Saint Petersburg State University |
. |
1 |
. |
. |
4 |
5 |
| Taiwan-ACADEMIA SINICA - TAIWAN |
. |
. |
. |
. |
5 |
5 |
| Taiwan-National Taiwan University |
. |
. |
. |
. |
5 |
5 |
| United Kingdom-Imperial College London |
2 |
2 |
1 |
. |
. |
5 |
| United Kingdom-University of Nottingham |
1 |
. |
1 |
2 |
1 |
5 |
| United States-Cornell University |
. |
2 |
1 |
1 |
1 |
5 |
| United States-Georgia Institute of Technology |
. |
. |
2 |
1 |
2 |
5 |
| United States-Johns Hopkins University |
1 |
. |
. |
3 |
1 |
5 |
| United States-Princeton University |
. |
1 |
1 |
2 |
1 |
5 |
| United States-UNIV MINNESOTA |
4 |
1 |
. |
. |
. |
5 |
| Australia-RMIT UNIV |
. |
. |
. |
. |
4 |
4 |
| China-Chinese University of Hong Kong |
. |
. |
. |
4 |
. |
4 |
| China-NANCHANG UNIV |
. |
. |
. |
4 |
. |
4 |
| China-Tsinghua University |
. |
. |
. |
1 |
3 |
4 |
| China-Univ Chinese Acad Sci |
. |
. |
. |
. |
4 |
4 |
| Czech Republic-Academy of Sciences of the Czech Republic |
. |
. |
. |
. |
4 |
4 |
| Denmark-Technical University of Denmark |
. |
1 |
1 |
. |
2 |
4 |
| Denmark-University of Southern Denmark |
. |
. |
2 |
2 |
. |
4 |
| Japan-Nagoya University |
. |
2 |
1 |
. |
1 |
4 |
| Japan-SAITAMA UNIV |
. |
. |
. |
3 |
1 |
4 |
| Mexico-UNIV AUTONOMA SAN LUIS POTOSI |
. |
. |
1 |
3 |
. |
4 |
| Netherlands-Wageningen University and Research Centre |
. |
. |
4 |
. |
. |
4 |
| Russian Federation-ST PETERSBURG STATE TECHNOL UNIV PLANT POLYMERS |
. |
. |
. |
2 |
2 |
4 |
| Singapore-Inst Chem & Engn Sci |
. |
. |
. |
2 |
2 |
4 |
| Turkey-Gebze Inst Technol |
. |
. |
. |
3 |
1 |
4 |
| United Kingdom-University of Oxford |
. |
. |
1 |
3 |
. |
4 |
| United States-Massachusetts Institute of Technology |
. |
1 |
1 |
2 |
. |
4 |
| United States-NATL INST STAND & TECHNOL |
3 |
. |
. |
1 |
. |
4 |
| United States-OAK RIDGE NATL LAB |
. |
. |
2 |
2 |
. |
4 |
| United States-University at Buffalo, The State University of New York |
. |
2 |
1 |
. |
1 |
4 |