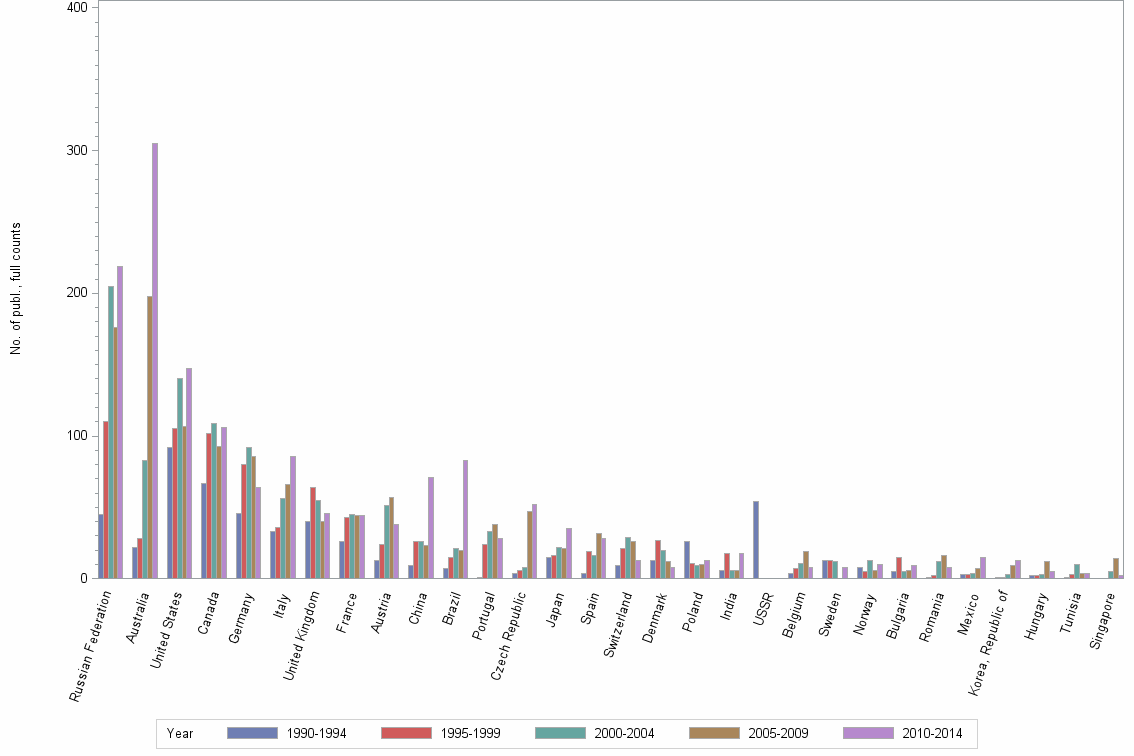
Lev3: POLYOXOMETALATES//POLYOXOMETALATE//POLYOXOMETALATE SCI - Statistics for Countries

Statistics per Country

Number of publications, full counts

Obs Country 1990-1994 1995-1999 2000-2004 2005-2009 2010-2014 All years
1 All countries 499 659 833 887 1049 3927
2 Russian Federation 45 110 205 176 219 755
3 Australia 22 28 83 198 305 636
4 United States 92 105 140 107 147 591
5 Canada 67 102 109 93 106 477
6 Germany 46 80 92 86 64 368
7 Italy 33 36 56 66 86 277
8 United Kingdom 40 64 55 40 46 245
9 France 26 43 45 44 44 202
10 Austria 13 24 51 57 38 183
11 China 9 26 26 23 71 155
12 Brazil 7 15 21 20 83 146
13 Portugal 1 24 33 38 28 124
14 Czech Republic 4 6 8 47 52 117
15 Japan 15 16 22 21 35 109
16 Spain 4 19 16 32 28 99
17 Switzerland 9 21 29 26 13 98
18 Denmark 13 27 20 12 8 80
19 Poland 26 11 9 10 13 69
20 India 6 18 6 6 18 54
21 USSR 54 . . . . 54
22 Belgium 4 7 11 19 8 49
23 Sweden 13 13 12 . 8 46
24 Norway 8 5 13 6 10 42
25 Bulgaria 5 15 5 6 9 40
26 Romania 1 2 12 16 8 39
27 Mexico 3 3 4 7 15 32
28 Korea, Republic of 1 1 3 9 13 27
29 Hungary 2 2 3 12 5 24
30 Tunisia 1 3 10 4 4 22
31 Singapore . . 5 14 2 21
32 Argentina 1 2 6 4 7 20
33 Slovak Republic . 5 5 4 5 19
34 Netherlands 1 4 8 1 4 18
35 Taiwan . . 4 12 2 18
36 Croatia 4 2 1 2 6 15
37 Turkey . 1 2 4 8 15
38 Finland 1 . 10 1 2 14
39 Ukraine . 3 2 4 5 14
40 South Africa 3 1 1 2 4 11
41 Egypt 1 1 . 2 6 10
42 Greece . 1 3 3 3 10
43 Kazakhstan . 1 1 3 5 10
44 Morocco 2 1 1 3 2 9
45 Czechoslovakia 7 . . . . 7
46 Saudi Arabia . 1 . 1 4 6
47 Colombia . . 4 1 . 5
48 Indonesia . 4 . 1 . 5
49 New Zealand 3 1 . . 1 5
50 Uzbekistan 3 1 . 1 . 5
51 Iran, Islamic Republic of . . . . 4 4
52 Latvia . . 2 2 . 4
53 Republic of Serbia . . . 1 3 4

Number of publications, full counts


Bar chart of publication_year

Share of the total number of publications in the field, full counts (%)

Obs Country 1990-1994 1995-1999 2000-2004 2005-2009 2010-2014 All years
1 All countries 100.0 100.0 100.0 100.0 100.0 100.0
2 Russian Federation 9.0 16.7 24.6 19.8 20.9 19.2
3 Australia 4.4 4.2 10.0 22.3 29.1 16.2
4 United States 18.4 15.9 16.8 12.1 14.0 15.0
5 Canada 13.4 15.5 13.1 10.5 10.1 12.1
6 Germany 9.2 12.1 11.0 9.7 6.1 9.4
7 Italy 6.6 5.5 6.7 7.4 8.2 7.1
8 United Kingdom 8.0 9.7 6.6 4.5 4.4 6.2
9 France 5.2 6.5 5.4 5.0 4.2 5.1
10 Austria 2.6 3.6 6.1 6.4 3.6 4.7
11 China 1.8 3.9 3.1 2.6 6.8 3.9
12 Brazil 1.4 2.3 2.5 2.3 7.9 3.7
13 Portugal 0.2 3.6 4.0 4.3 2.7 3.2
14 Czech Republic 0.8 0.9 1.0 5.3 5.0 3.0
15 Japan 3.0 2.4 2.6 2.4 3.3 2.8
16 Spain 0.8 2.9 1.9 3.6 2.7 2.5
17 Switzerland 1.8 3.2 3.5 2.9 1.2 2.5
18 Denmark 2.6 4.1 2.4 1.4 0.8 2.0
19 Poland 5.2 1.7 1.1 1.1 1.2 1.8
20 India 1.2 2.7 0.7 0.7 1.7 1.4
21 USSR 10.8 . . . . 1.4
22 Belgium 0.8 1.1 1.3 2.1 0.8 1.2
23 Sweden 2.6 2.0 1.4 . 0.8 1.2
24 Norway 1.6 0.8 1.6 0.7 1.0 1.1
25 Bulgaria 1.0 2.3 0.6 0.7 0.9 1.0
26 Romania 0.2 0.3 1.4 1.8 0.8 1.0
27 Mexico 0.6 0.5 0.5 0.8 1.4 0.8
28 Korea, Republic of 0.2 0.2 0.4 1.0 1.2 0.7
29 Hungary 0.4 0.3 0.4 1.4 0.5 0.6
30 Tunisia 0.2 0.5 1.2 0.5 0.4 0.6
31 Singapore . . 0.6 1.6 0.2 0.5
32 Argentina 0.2 0.3 0.7 0.5 0.7 0.5
33 Slovak Republic . 0.8 0.6 0.5 0.5 0.5
34 Netherlands 0.2 0.6 1.0 0.1 0.4 0.5
35 Taiwan . . 0.5 1.4 0.2 0.5
36 Croatia 0.8 0.3 0.1 0.2 0.6 0.4
37 Turkey . 0.2 0.2 0.5 0.8 0.4
38 Finland 0.2 . 1.2 0.1 0.2 0.4
39 Ukraine . 0.5 0.2 0.5 0.5 0.4
40 South Africa 0.6 0.2 0.1 0.2 0.4 0.3
41 Egypt 0.2 0.2 . 0.2 0.6 0.3
42 Greece . 0.2 0.4 0.3 0.3 0.3
43 Kazakhstan . 0.2 0.1 0.3 0.5 0.3
44 Morocco 0.4 0.2 0.1 0.3 0.2 0.2
45 Czechoslovakia 1.4 . . . . 0.2
46 Saudi Arabia . 0.2 . 0.1 0.4 0.2
47 Colombia . . 0.5 0.1 . 0.1
48 Indonesia . 0.6 . 0.1 . 0.1
49 New Zealand 0.6 0.2 . . 0.1 0.1
50 Uzbekistan 0.6 0.2 . 0.1 . 0.1
51 Iran, Islamic Republic of . . . . 0.4 0.1
52 Latvia . . 0.2 0.2 . 0.1
53 Republic of Serbia . . . 0.1 0.3 0.1

Share of the total number of publications in the field, full counts (%)


Bar chart of publication_year

Number of publications among 10% most cited in field, full counts

Obs Country 1990-1994 1995-1999 2000-2004 2005-2009 2010-2014 All years
1 All countries 18.3 39.1 42.4 31.0 17.6 148.5
2 Russian Federation 0.2 7.0 3.5 3.2 4.5 18.4
3 Australia 1.5 1.0 12.4 13.0 3.5 31.4
4 United States 6.7 11.3 12.2 2.0 3.1 35.2
5 Canada 3.3 3.6 1.2 5.4 2.1 15.6
6 Germany 1.5 0.2 1.7 2.0 0.6 5.9
7 Italy 1.0 4.0 3.1 2.5 3.9 14.5
8 United Kingdom 3.0 10.0 3.1 2.3 0.0 18.4
9 France 0.2 4.5 0.9 0.2 0.0 5.7
10 Austria 0.2 1.0 2.3 1.0 1.0 5.5
11 China 0.0 1.5 0.0 0.0 1.0 2.5
12 Brazil 0.0 0.0 0.0 0.5 0.0 0.5
13 Portugal 1.0 3.5 1.0 1.0 0.3 6.8
14 Czech Republic 0.0 0.0 0.0 1.0 0.3 1.3
15 Japan 1.0 2.0 0.8 1.0 0.0 4.8
16 Spain 0.0 1.0 0.0 0.5 0.0 1.5
17 Switzerland 0.0 0.0 0.0 0.5 0.0 0.5
18 Denmark 0.0 1.0 0.0 0.0 0.0 1.0
19 Poland 0.0 0.0 0.0 0.5 1.0 1.5
20 India 0.0 1.0 0.0 0.0 0.4 1.4
21 USSR 2.0 . . . . 2.0
22 Belgium 0.0 0.0 0.1 1.0 0.0 1.1
23 Sweden 1.0 1.2 0.0 . 0.4 2.7
24 Norway 0.0 0.0 0.0 0.0 0.4 0.4
25 Bulgaria 0.0 0.0 1.0 0.0 0.0 1.0
26 Romania 0.0 0.0 0.4 0.3 1.0 1.8
27 Mexico 0.0 0.0 0.0 0.0 0.0 0.0
28 Korea, Republic of 0.0 0.0 0.0 0.5 0.0 0.5
29 Hungary 0.0 0.0 0.0 2.2 0.0 2.2
30 Tunisia 0.0 0.0 0.0 0.0 0.0 0.0
31 Singapore . . 1.7 0.0 0.9 2.6
32 Argentina 0.0 0.0 0.0 0.0 0.0 0.0
33 Slovak Republic . 0.0 0.0 0.0 0.0 0.0
34 Netherlands 0.0 0.0 0.0 0.0 0.0 0.0
35 Taiwan . . 0.0 0.0 0.0 0.0
36 Croatia 0.0 0.0 0.0 0.0 0.0 0.0
37 Turkey . 0.0 0.0 0.0 0.0 0.0
38 Finland 0.0 . 0.0 0.0 0.0 0.0
39 Ukraine . 0.0 0.0 0.0 0.0 0.0
40 South Africa 0.0 0.0 0.0 0.0 0.0 0.0
41 Egypt 0.0 0.0 . 0.0 0.2 0.2
42 Greece . 0.0 0.0 0.0 0.0 0.0
43 Kazakhstan . 0.0 0.0 0.0 0.0 0.0
44 Morocco 0.0 0.0 0.0 0.0 0.0 0.0
45 Czechoslovakia 0.0 . . . . 0.0
46 Saudi Arabia . 0.0 . 0.0 0.0 0.0
47 Colombia . . 0.0 0.0 . 0.0
48 Indonesia . 0.0 . 0.0 . 0.0
49 New Zealand 0.0 0.0 . . 0.0 0.0
50 Uzbekistan 0.0 0.0 . 0.0 . 0.0
51 Iran, Islamic Republic of . . . . 0.0 0.0
52 Latvia . . 0.0 0.0 . 0.0
53 Republic of Serbia . . . 0.0 0.0 0.0

Number of publications among 10% most cited in field, full counts


Bar chart of publication_year

Share of publications among 10% most cited in field, fractionalized (%)

Obs Country 1990-1994 1995-1999 2000-2004 2005-2009 2010-2014 All years
1 All countries 3.7 5.9 5.1 3.5 1.7 3.8
2 Russian Federation 0.5 6.4 2.2 2.0 2.0 2.6
3 Australia 9.1 2.6 17.0 6.3 1.2 5.7
4 United States 8.9 13.9 11.3 2.3 2.9 7.8
5 Canada 6.0 4.2 1.5 6.4 3.6 4.1
6 Germany 2.6 0.1 2.6 3.2 0.6 1.8
7 Italy 1.7 9.1 8.8 4.1 3.4 5.1
8 United Kingdom 6.8 16.5 6.9 6.1 0.0 8.0
9 France 0.4 5.6 3.2 0.3 0.0 2.1
10 Austria 0.9 6.1 4.8 2.8 1.2 3.4
11 China 0.4 2.7 0.0 0.0 1.2 1.0
12 Brazil 0.0 0.0 0.0 1.9 0.0 0.3
13 Portugal 100.0 11.1 3.7 2.0 1.1 3.6
14 Czech Republic 0.0 0.0 0.0 2.0 0.6 1.0
15 Japan 3.0 11.1 3.0 5.9 0.0 3.7
16 Spain 0.0 4.2 0.0 2.0 0.0 1.5
17 Switzerland 0.0 0.0 0.0 1.5 0.0 0.3
18 Denmark 0.0 5.8 0.0 0.0 0.0 1.9
19 Poland 0.0 0.0 0.0 4.7 10.4 2.3
20 India 0.0 5.9 0.0 0.3 2.8 3.0
21 USSR 3.9 . . . . 3.9
22 Belgium 0.0 0.0 0.8 3.0 0.0 1.2
23 Sweden 1.9 3.8 0.0 . 8.0 2.7
24 Norway 0.0 0.0 0.0 0.0 3.4 0.6
25 Bulgaria 0.0 0.0 14.3 0.0 0.0 1.6
26 Romania 0.0 0.0 4.7 3.8 9.9 4.9
27 Mexico 0.0 0.0 0.0 0.0 0.0 0.0
28 Korea, Republic of 0.0 0.0 0.0 6.4 0.0 2.0
29 Hungary 0.0 0.0 0.0 18.3 0.0 10.3
30 Tunisia 0.0 0.0 0.0 0.0 0.0 0.0
31 Singapore . . 33.3 0.0 23.5 9.9
32 Argentina 0.0 0.0 0.0 0.0 0.0 0.0
33 Slovak Republic . 0.0 0.0 0.0 0.0 0.0
34 Netherlands 0.0 0.0 0.0 0.0 0.0 0.0
35 Taiwan . . 0.0 0.0 0.0 0.0
36 Croatia 0.0 0.0 0.0 0.0 0.0 0.0
37 Turkey . 0.0 0.0 0.0 0.0 0.0
38 Finland 0.0 . 0.0 0.0 0.0 0.0
39 Ukraine . 0.0 0.0 0.0 0.0 0.0
40 South Africa 0.0 0.0 0.0 0.0 0.0 0.0
41 Egypt 0.0 0.0 . 0.0 5.1 3.1
42 Greece . 0.0 0.0 0.0 0.0 0.0
43 Kazakhstan . 0.0 0.0 0.0 0.0 0.0
44 Morocco 0.0 0.0 0.0 0.0 0.0 0.0
45 Czechoslovakia 0.0 . . . . 0.0
46 Saudi Arabia . 0.0 . 0.0 0.0 0.0
47 Colombia . . 0.0 0.0 . 0.0
48 Indonesia . 0.0 . 0.0 . 0.0
49 New Zealand 0.0 0.0 . . 0.0 0.0
50 Uzbekistan 0.0 0.0 . 0.0 . 0.0
51 Iran, Islamic Republic of . . . . 0.0 0.0
52 Latvia . . 0.0 0.0 . 0.0
53 Republic of Serbia . . . 0.0 0.0 0.0

Share of publications among 10% most cited in field, fractionalized (%)


Bar chart of publication_year

Field normalized citation rate (cf), fractionalized

Obs Country 1990-1994 1995-1999 2000-2004 2005-2009 2010-2014 All years
1 All countries 1.01 0.72 0.72 0.59 0.46 0.66
2 Russian Federation 0.17 0.43 0.37 0.34 0.46 0.39
3 Australia 0.47 0.59 1.28 0.86 0.40 0.70
4 United States 4.01 1.08 1.64 0.63 0.54 1.50
5 Canada 0.93 0.60 0.53 0.59 0.54 0.63
6 Germany 0.45 0.38 0.58 0.61 0.50 0.50
7 Italy 0.46 0.73 0.78 0.61 0.65 0.65
8 United Kingdom 0.69 1.99 0.88 0.61 0.47 1.01
9 France 0.54 0.56 0.61 0.56 0.34 0.53
10 Austria 0.39 2.02 0.50 0.55 0.42 0.71
11 China 0.26 0.45 0.26 0.26 0.35 0.34
12 Brazil 0.38 0.50 0.46 0.51 0.47 0.47
13 Portugal 17.82 1.37 0.92 0.66 0.37 0.79
14 Czech Republic 0.10 0.45 0.45 0.66 0.57 0.56
15 Japan 1.02 0.97 0.38 0.48 0.22 0.52
16 Spain 1.03 0.78 0.53 0.48 0.65 0.61
17 Switzerland 0.51 0.34 0.39 0.38 0.50 0.40
18 Denmark 0.48 0.54 0.45 0.55 0.44 0.50
19 Poland 0.09 0.02 0.29 0.55 0.88 0.29
20 India 0.35 0.80 0.69 0.50 0.55 0.62
21 USSR 0.22 . . . . 0.22
22 Belgium 0.24 0.57 0.42 0.57 0.23 0.45
23 Sweden 0.64 0.57 0.29 . 0.70 0.53
24 Norway 0.24 0.20 0.34 0.38 0.88 0.38
25 Bulgaria 0.96 0.66 0.66 0.32 0.16 0.55
26 Romania 0.00 0.31 0.60 0.44 1.06 0.59
27 Mexico 1.10 0.43 1.20 0.04 0.06 0.25
28 Korea, Republic of 0.05 0.62 0.92 0.77 0.28 0.50
29 Hungary 0.75 0.09 0.61 1.21 0.20 0.83
30 Tunisia 0.30 0.06 0.30 0.30 0.04 0.21
31 Singapore . . 1.88 0.63 1.69 1.01
32 Argentina 0.22 1.03 0.68 0.32 0.59 0.60
33 Slovak Republic . 0.20 0.18 0.31 0.18 0.21
34 Netherlands 1.76 0.79 0.35 0.32 0.29 0.59
35 Taiwan . . 0.60 0.97 0.74 0.86
36 Croatia 0.67 0.09 0.51 0.38 0.46 0.45
37 Turkey . 0.75 0.17 0.87 0.10 0.37
38 Finland 0.00 . 0.94 0.35 0.30 0.78
39 Ukraine . 0.57 0.26 0.14 0.37 0.36
40 South Africa 0.29 0.22 0.05 0.27 0.44 0.28
41 Egypt 0.20 0.06 . 0.27 0.60 0.43
42 Greece . 0.38 0.86 0.63 0.18 0.65
43 Kazakhstan . 0.27 0.47 0.12 0.21 0.21
44 Morocco 1.35 0.41 0.09 0.39 0.15 0.53
45 Czechoslovakia 0.28 . . . . 0.28
46 Saudi Arabia . 0.13 . 1.29 0.46 0.61
47 Colombia . . 0.30 0.29 . 0.30
48 Indonesia . 0.05 . 0.84 . 0.27
49 New Zealand 0.25 0.53 . . 0.76 0.33
50 Uzbekistan 0.03 0.00 . 0.04 . 0.03
51 Iran, Islamic Republic of . . . . 0.22 0.22
52 Latvia . . 0.00 0.00 . 0.00
53 Republic of Serbia . . . 0.51 0.10 0.19

Field normalized citation rate (cf), fractionalized


Bar chart of publication_year