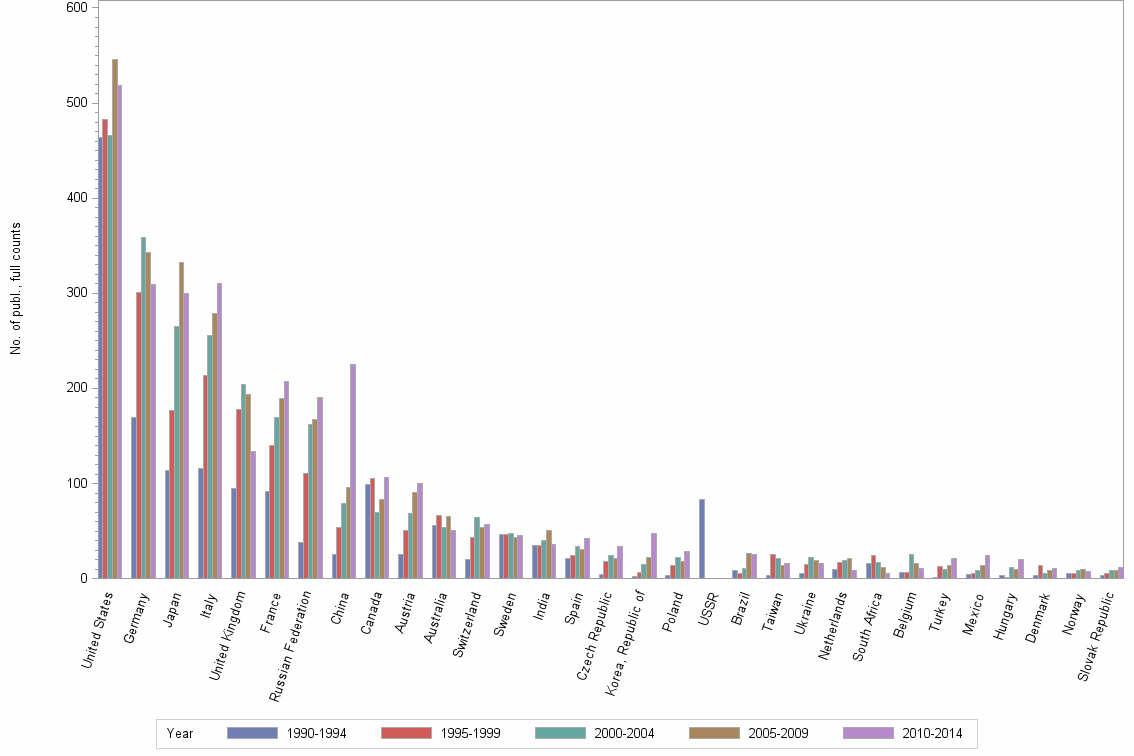
Lev3: MINERALOGY//PHYSICS AND CHEMISTRY OF MINERALS//AMERICAN MINERALOGIST - Statistics for Countries

Statistics per Country

Number of publications, full counts

Obs Country 1990-1994 1995-1999 2000-2004 2005-2009 2010-2014 All years
1 All countries 1371 1686 1783 1895 1932 8667
2 United States 464 483 466 546 519 2478
3 Germany 169 301 359 343 309 1481
4 Japan 114 177 265 332 300 1188
5 Italy 116 214 256 279 310 1175
6 United Kingdom 95 178 204 194 134 805
7 France 92 140 169 189 207 797
8 Russian Federation 38 111 162 167 190 668
9 China 25 54 79 96 225 479
10 Canada 99 105 70 83 106 463
11 Austria 26 51 69 91 100 337
12 Australia 56 66 54 65 51 292
13 Switzerland 20 43 64 54 57 238
14 Sweden 46 46 48 43 45 228
15 India 35 35 40 51 36 197
16 Spain 21 24 34 31 42 152
17 Czech Republic 4 18 24 21 34 101
18 Korea, Republic of 2 7 15 22 48 94
19 Poland 3 14 22 18 29 86
20 USSR 83 . . . . 83
21 Brazil 9 6 11 27 26 79
22 Taiwan 3 25 21 14 16 79
23 Ukraine 6 15 22 19 16 78
24 Netherlands 10 17 19 21 9 76
25 South Africa 16 24 17 12 6 75
26 Belgium 7 7 25 16 11 66
27 Turkey 1 13 10 14 21 59
28 Mexico 4 5 9 14 24 56
29 Hungary 3 1 12 10 20 46
30 Denmark 3 14 6 9 11 43
31 Norway 6 6 9 10 8 39
32 Slovak Republic 3 6 9 9 12 39
33 Bulgaria 12 5 6 4 4 31
34 Greece 11 7 3 7 3 31
35 New Zealand 11 11 6 2 1 31
36 Israel 3 4 9 5 7 28
37 Argentina 7 2 4 9 5 27
38 Iran, Islamic Republic of . . 1 8 16 25
39 Portugal 5 5 2 3 9 24
40 Algeria 1 . . 6 16 23
41 Egypt 5 2 3 1 10 21
42 Morocco 2 2 6 3 2 15
43 Romania 2 1 5 2 5 15
44 Pakistan . 1 1 1 11 14
45 Cuba 1 1 5 4 2 13
46 Finland 2 5 2 . 4 13
47 Saudi Arabia . 1 . . 11 12
48 Czechoslovakia 11 . . . . 11
49 Croatia 1 1 2 3 2 9
50 Macedonia . . . 7 2 9
51 Belarus . 3 . . 5 8

Number of publications, full counts


Bar chart of publication_year

Share of the total number of publications in the field, full counts (%)

Obs Country 1990-1994 1995-1999 2000-2004 2005-2009 2010-2014 All years
1 All countries 100.0 100.0 100.0 100.0 100.0 100.0
2 United States 33.8 28.6 26.1 28.8 26.9 28.6
3 Germany 12.3 17.9 20.1 18.1 16.0 17.1
4 Japan 8.3 10.5 14.9 17.5 15.5 13.7
5 Italy 8.5 12.7 14.4 14.7 16.0 13.6
6 United Kingdom 6.9 10.6 11.4 10.2 6.9 9.3
7 France 6.7 8.3 9.5 10.0 10.7 9.2
8 Russian Federation 2.8 6.6 9.1 8.8 9.8 7.7
9 China 1.8 3.2 4.4 5.1 11.6 5.5
10 Canada 7.2 6.2 3.9 4.4 5.5 5.3
11 Austria 1.9 3.0 3.9 4.8 5.2 3.9
12 Australia 4.1 3.9 3.0 3.4 2.6 3.4
13 Switzerland 1.5 2.6 3.6 2.8 3.0 2.7
14 Sweden 3.4 2.7 2.7 2.3 2.3 2.6
15 India 2.6 2.1 2.2 2.7 1.9 2.3
16 Spain 1.5 1.4 1.9 1.6 2.2 1.8
17 Czech Republic 0.3 1.1 1.3 1.1 1.8 1.2
18 Korea, Republic of 0.1 0.4 0.8 1.2 2.5 1.1
19 Poland 0.2 0.8 1.2 0.9 1.5 1.0
20 USSR 6.1 . . . . 1.0
21 Brazil 0.7 0.4 0.6 1.4 1.3 0.9
22 Taiwan 0.2 1.5 1.2 0.7 0.8 0.9
23 Ukraine 0.4 0.9 1.2 1.0 0.8 0.9
24 Netherlands 0.7 1.0 1.1 1.1 0.5 0.9
25 South Africa 1.2 1.4 1.0 0.6 0.3 0.9
26 Belgium 0.5 0.4 1.4 0.8 0.6 0.8
27 Turkey 0.1 0.8 0.6 0.7 1.1 0.7
28 Mexico 0.3 0.3 0.5 0.7 1.2 0.6
29 Hungary 0.2 0.1 0.7 0.5 1.0 0.5
30 Denmark 0.2 0.8 0.3 0.5 0.6 0.5
31 Norway 0.4 0.4 0.5 0.5 0.4 0.4
32 Slovak Republic 0.2 0.4 0.5 0.5 0.6 0.4
33 Bulgaria 0.9 0.3 0.3 0.2 0.2 0.4
34 Greece 0.8 0.4 0.2 0.4 0.2 0.4
35 New Zealand 0.8 0.7 0.3 0.1 0.1 0.4
36 Israel 0.2 0.2 0.5 0.3 0.4 0.3
37 Argentina 0.5 0.1 0.2 0.5 0.3 0.3
38 Iran, Islamic Republic of . . 0.1 0.4 0.8 0.3
39 Portugal 0.4 0.3 0.1 0.2 0.5 0.3
40 Algeria 0.1 . . 0.3 0.8 0.3
41 Egypt 0.4 0.1 0.2 0.1 0.5 0.2
42 Morocco 0.1 0.1 0.3 0.2 0.1 0.2
43 Romania 0.1 0.1 0.3 0.1 0.3 0.2
44 Pakistan . 0.1 0.1 0.1 0.6 0.2
45 Cuba 0.1 0.1 0.3 0.2 0.1 0.1
46 Finland 0.1 0.3 0.1 . 0.2 0.1
47 Saudi Arabia . 0.1 . . 0.6 0.1
48 Czechoslovakia 0.8 . . . . 0.1
49 Croatia 0.1 0.1 0.1 0.2 0.1 0.1
50 Macedonia . . . 0.4 0.1 0.1
51 Belarus . 0.2 . . 0.3 0.1

Share of the total number of publications in the field, full counts (%)


Bar chart of publication_year

Number of publications among 10% most cited in field, full counts

Obs Country 1990-1994 1995-1999 2000-2004 2005-2009 2010-2014 All years
1 All countries 162.6 146.4 138.4 135.5 109.4 692.5
2 United States 81.0 63.8 52.4 66.3 60.3 323.9
3 Germany 28.6 33.7 29.4 26.2 19.3 137.2
4 Japan 21.7 23.3 26.4 27.1 15.0 113.4
5 Italy 10.7 17.9 20.4 17.5 15.2 81.7
6 United Kingdom 14.9 20.9 18.9 10.9 9.1 74.7
7 France 8.2 13.2 18.1 23.0 23.0 85.5
8 Russian Federation 0.0 6.5 3.8 5.2 4.0 19.4
9 China 2.0 4.0 1.0 2.0 7.2 16.2
10 Canada 18.0 15.5 4.9 3.0 6.4 47.7
11 Austria 1.0 3.0 3.0 0.0 5.8 12.8
12 Australia 7.5 9.5 2.5 8.0 7.5 35.0
13 Switzerland 5.5 3.0 6.0 8.1 2.8 25.3
14 Sweden 3.5 0.0 7.0 1.0 3.0 14.5
15 India 0.0 0.0 0.0 0.0 0.0 0.0
16 Spain 0.0 0.0 2.0 2.0 1.0 5.0
17 Czech Republic 0.0 3.0 1.0 0.0 3.0 7.0
18 Korea, Republic of 0.0 0.0 1.0 1.0 2.1 4.1
19 Poland 0.0 0.0 1.0 0.0 1.0 2.0
20 USSR 2.0 . . . . 2.0
21 Brazil 0.0 1.8 0.0 2.0 1.5 5.3
22 Taiwan 0.0 0.0 1.0 1.0 2.0 4.0
23 Ukraine 0.0 0.0 1.5 0.8 0.0 2.3
24 Netherlands 0.0 3.0 1.5 1.0 0.0 5.5
25 South Africa 0.0 0.0 0.0 0.0 0.0 0.0
26 Belgium 0.0 0.0 0.0 1.0 1.1 2.1
27 Turkey 0.0 0.0 0.0 0.3 0.0 0.3
28 Mexico 0.0 0.0 5.0 3.4 1.3 9.8
29 Hungary 0.0 0.0 1.0 3.0 4.0 8.0
30 Denmark 1.0 0.0 0.0 0.0 0.0 1.0
31 Norway 0.0 1.0 1.0 0.0 0.0 2.0
32 Slovak Republic 0.0 0.0 0.0 0.0 1.0 1.0
33 Bulgaria 0.0 0.0 0.0 0.0 0.0 0.0
34 Greece 0.0 0.0 0.0 0.0 0.0 0.0
35 New Zealand 0.0 2.0 0.0 0.0 0.0 2.0
36 Israel 0.0 3.0 2.5 1.5 0.3 7.3
37 Argentina 0.0 0.0 0.0 0.0 0.0 0.0
38 Iran, Islamic Republic of . . 0.0 0.0 0.0 0.0
39 Portugal 2.0 2.0 0.0 0.0 0.0 4.0
40 Algeria 0.0 . . 0.0 1.3 1.3
41 Egypt 0.0 0.0 0.0 0.0 0.0 0.0
42 Morocco 0.0 0.0 1.0 0.0 0.0 1.0
43 Romania 0.0 0.0 0.0 0.0 0.0 0.0
44 Pakistan . 0.0 0.0 0.0 1.0 1.0
45 Cuba 0.0 0.0 0.0 0.0 0.0 0.0
46 Finland 0.0 0.0 0.0 . 0.0 0.0
47 Saudi Arabia . 0.0 . . 0.3 0.3
48 Czechoslovakia 1.0 . . . . 1.0
49 Croatia 0.0 0.0 0.0 1.0 0.0 1.0
50 Macedonia . . . 0.0 0.0 0.0
51 Belarus . 0.0 . . 0.0 0.0

Number of publications among 10% most cited in field, full counts


Bar chart of publication_year

Share of publications among 10% most cited in field, fractionalized (%)

Obs Country 1990-1994 1995-1999 2000-2004 2005-2009 2010-2014 All years
1 All countries 11.9 8.7 7.8 7.2 5.7 8.0
2 United States 17.2 13.1 12.0 12.7 11.9 13.5
3 Germany 14.8 10.7 8.8 7.9 5.6 9.3
4 Japan 18.6 12.0 10.0 8.1 4.6 9.3
5 Italy 7.4 7.5 6.5 5.0 3.8 5.8
6 United Kingdom 15.0 10.3 10.2 6.5 5.8 9.5
7 France 9.7 9.4 10.0 11.4 12.6 10.7
8 Russian Federation 0.0 1.5 1.3 2.0 0.8 1.3
9 China 8.2 1.4 0.5 1.6 2.1 1.9
10 Canada 18.2 11.7 7.3 4.5 4.6 10.2
11 Austria 2.0 4.6 3.0 0.0 3.4 2.6
12 Australia 12.2 10.1 4.4 12.7 18.0 11.2
13 Switzerland 24.8 4.4 9.9 18.0 5.2 10.8
14 Sweden 5.3 0.0 11.7 1.8 5.8 4.7
15 India 0.0 0.0 0.0 0.0 0.0 0.0
16 Spain 0.0 0.0 5.0 8.0 2.2 3.2
17 Czech Republic 0.0 8.2 4.3 0.0 7.5 4.7
18 Korea, Republic of 0.0 0.0 2.1 1.0 4.5 2.8
19 Poland 0.0 0.0 1.6 0.0 1.1 0.8
20 USSR 2.6 . . . . 2.6
21 Brazil 0.0 15.6 0.0 2.1 3.6 2.9
22 Taiwan 0.0 0.0 5.9 2.7 5.6 3.3
23 Ukraine 0.0 0.0 6.7 3.3 0.0 2.4
24 Netherlands 0.0 2.5 1.3 3.8 0.0 2.0
25 South Africa 0.0 0.0 0.0 0.0 0.0 0.0
26 Belgium 0.0 0.0 0.0 5.2 4.2 1.6
27 Turkey 0.0 0.0 0.0 3.2 0.0 0.7
28 Mexico 0.0 0.0 35.6 14.8 2.1 8.8
29 Hungary 0.0 0.0 4.6 15.2 11.2 9.1
30 Denmark 34.8 0.0 0.0 0.0 0.0 2.8
31 Norway 0.0 21.0 12.8 0.0 0.0 6.6
32 Slovak Republic 0.0 0.0 0.0 0.0 2.8 0.7
33 Bulgaria 0.0 0.0 0.0 0.0 0.0 0.0
34 Greece 0.0 0.0 0.0 0.0 0.0 0.0
35 New Zealand 0.0 16.5 0.0 0.0 0.0 4.0
36 Israel 0.0 23.5 12.1 30.4 5.3 13.7
37 Argentina 0.0 0.0 0.0 0.0 0.0 0.0
38 Iran, Islamic Republic of . . 0.0 0.0 0.0 0.0
39 Portugal 36.0 9.1 0.0 0.0 0.0 10.3
40 Algeria 0.0 . . 0.0 7.3 4.3
41 Egypt 0.0 0.0 0.0 0.0 0.0 0.0
42 Morocco 0.0 0.0 20.0 0.0 0.0 6.7
43 Romania 0.0 0.0 0.0 0.0 0.0 0.0
44 Pakistan . 0.0 0.0 0.0 7.3 5.3
45 Cuba 0.0 0.0 0.0 0.0 0.0 0.0
46 Finland 0.0 0.0 0.0 . 0.0 0.0
47 Saudi Arabia . 0.0 . . 3.1 2.4
48 Czechoslovakia 10.2 . . . . 10.2
49 Croatia 0.0 0.0 0.0 11.8 0.0 2.2
50 Macedonia . . . 0.0 0.0 0.0
51 Belarus . 0.0 . . 0.0 0.0

Share of publications among 10% most cited in field, fractionalized (%)


Bar chart of publication_year

Field normalized citation rate (cf), fractionalized

Obs Country 1990-1994 1995-1999 2000-2004 2005-2009 2010-2014 All years
1 All countries 1.04 0.96 0.91 0.87 0.75 0.90
2 United States 1.44 1.26 1.25 1.21 1.09 1.25
3 Germany 1.13 1.19 0.97 0.91 0.79 1.00
4 Japan 1.34 1.07 1.13 0.95 0.74 1.00
5 Italy 0.80 0.84 0.88 1.01 0.80 0.87
6 United Kingdom 1.26 1.22 1.07 0.85 0.85 1.06
7 France 0.89 0.99 1.18 1.04 1.30 1.09
8 Russian Federation 0.25 0.32 0.32 0.31 0.25 0.30
9 China 1.41 0.39 0.37 0.38 0.41 0.45
10 Canada 1.41 1.32 0.85 0.66 0.76 1.06
11 Austria 0.52 0.84 0.73 0.49 0.63 0.64
12 Australia 1.04 0.95 0.59 1.10 1.32 0.99
13 Switzerland 1.23 0.76 1.12 1.39 0.65 1.01
14 Sweden 0.75 0.41 0.87 0.67 0.80 0.68
15 India 0.28 0.22 0.31 0.33 0.30 0.29
16 Spain 0.51 0.38 0.73 0.73 0.63 0.60
17 Czech Republic 0.42 0.60 0.49 0.35 0.80 0.57
18 Korea, Republic of 0.61 0.26 0.48 0.57 0.78 0.63
19 Poland 0.18 0.20 0.45 0.34 0.45 0.37
20 USSR 0.20 . . . . 0.20
21 Brazil 0.16 0.83 0.63 0.50 0.48 0.48
22 Taiwan 0.49 0.42 0.64 0.43 0.54 0.52
23 Ukraine 0.48 0.36 0.85 0.52 0.40 0.54
24 Netherlands 0.47 0.90 0.74 0.71 0.79 0.72
25 South Africa 0.38 0.37 0.40 0.22 0.11 0.34
26 Belgium 0.59 0.29 0.38 0.68 1.67 0.59
27 Turkey 1.24 0.45 0.40 0.53 0.19 0.36
28 Mexico 0.57 0.32 2.33 5.16 1.17 2.08
29 Hungary 0.23 0.05 0.56 0.83 0.92 0.74
30 Denmark 1.27 0.64 0.46 0.64 0.35 0.61
31 Norway 1.17 1.18 1.21 0.60 0.45 0.88
32 Slovak Republic 1.00 0.14 0.27 0.53 0.70 0.48
33 Bulgaria 0.12 0.42 0.22 0.11 0.04 0.18
34 Greece 0.39 0.22 0.21 0.28 0.29 0.30
35 New Zealand 0.29 1.03 0.26 0.12 0.00 0.45
36 Israel 0.48 5.94 0.92 1.60 1.30 1.58
37 Argentina 0.18 0.13 0.28 0.21 0.42 0.24
38 Iran, Islamic Republic of . . 0.22 0.46 0.31 0.35
39 Portugal 2.53 1.11 0.06 0.76 0.35 1.02
40 Algeria 0.03 . . 0.76 0.68 0.66
41 Egypt 0.14 0.08 0.20 0.00 0.27 0.19
42 Morocco 0.23 0.04 0.96 0.16 1.00 0.60
43 Romania 0.04 0.05 0.24 0.08 0.17 0.14
44 Pakistan . 0.34 0.28 0.59 0.66 0.59
45 Cuba 0.11 0.72 0.36 0.39 0.10 0.33
46 Finland 0.22 0.17 0.10 . 0.27 0.20
47 Saudi Arabia . 0.32 . . 0.82 0.71
48 Czechoslovakia 0.66 . . . . 0.66
49 Croatia 0.93 0.23 0.31 1.06 0.29 0.50
50 Macedonia . . . 0.42 0.37 0.41
51 Belarus . 0.07 . . 0.02 0.03

Field normalized citation rate (cf), fractionalized


Bar chart of publication_year