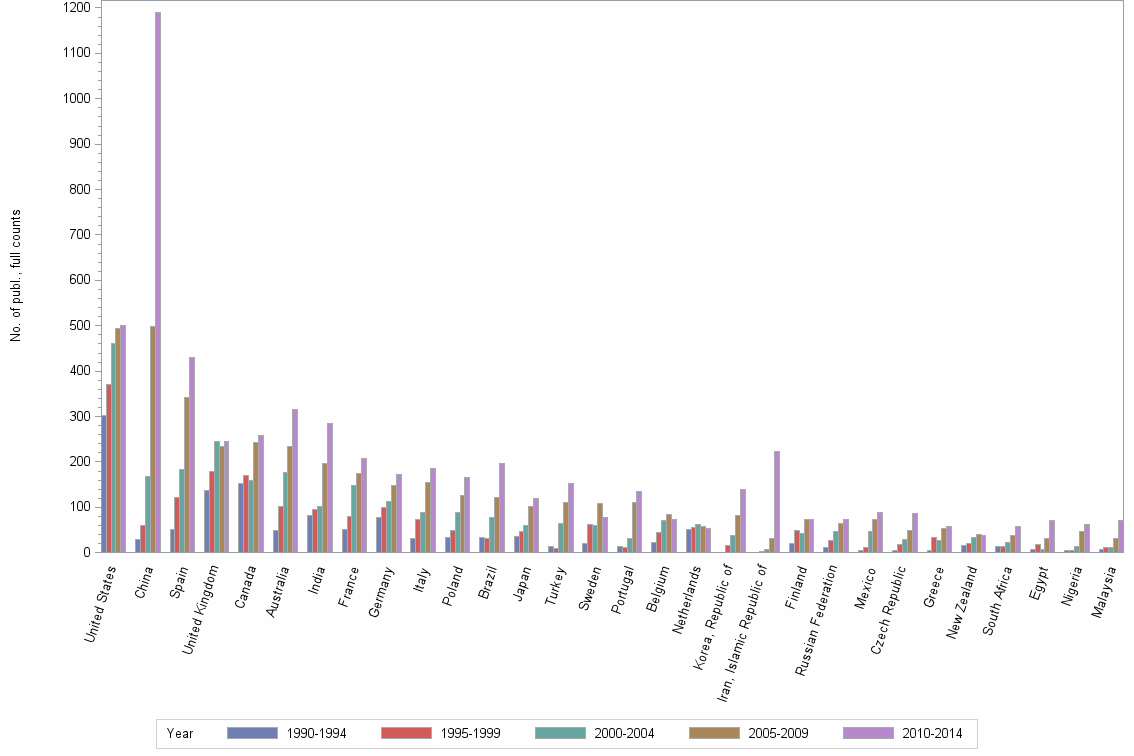
Lev3: HEAVY METALS//CADMIUM//ENVIRONMENTAL TOXICOLOGY AND CHEMISTRY - Statistics for Countries

Statistics per Country

Number of publications, full counts

Obs Country 1990-1994 1995-1999 2000-2004 2005-2009 2010-2014 All years
1 All countries 1318 1880 2553 3909 5364 15024
2 United States 303 370 460 495 500 2128
3 China 30 61 169 499 1190 1949
4 Spain 51 121 184 341 431 1128
5 United Kingdom 138 180 245 234 244 1041
6 Canada 153 171 159 243 259 985
7 Australia 50 101 177 233 316 877
8 India 83 96 102 196 285 762
9 France 51 79 148 174 207 659
10 Germany 77 99 113 149 172 610
11 Italy 32 73 89 155 185 534
12 Poland 33 50 88 126 166 463
13 Brazil 34 32 78 121 196 461
14 Japan 36 46 60 103 120 365
15 Turkey 13 9 64 110 152 348
16 Sweden 20 63 60 109 78 330
17 Portugal 13 11 31 111 135 301
18 Belgium 22 45 71 84 74 296
19 Netherlands 51 56 62 58 54 281
20 Korea, Republic of 1 16 39 83 139 278
21 Iran, Islamic Republic of 1 3 8 32 222 266
22 Finland 21 48 42 73 74 258
23 Russian Federation 12 27 47 64 74 224
24 Mexico 4 12 46 73 88 223
25 Czech Republic 5 19 30 49 86 189
26 Greece 6 33 26 53 58 176
27 New Zealand 17 20 33 41 38 149
28 South Africa 13 14 22 39 58 146
29 Egypt 7 19 8 32 70 136
30 Nigeria 6 6 13 47 63 135
31 Malaysia 8 12 11 31 72 134
32 Pakistan 2 3 11 33 81 130
33 Norway 11 26 24 33 27 121
34 Taiwan 11 17 19 20 51 118
35 Denmark 6 17 22 36 31 112
36 Switzerland 9 14 21 40 22 106
37 Chile 5 9 5 35 49 103
38 Argentina . 7 21 31 42 101
39 Slovenia 2 4 14 32 43 95
40 Hungary 6 14 18 31 23 92
41 Romania . 2 9 21 58 90
42 Austria 6 8 13 29 31 87
43 Republic of Serbia . . . 23 63 86
44 Thailand 8 2 20 30 26 86
45 Croatia 1 13 11 23 36 84
46 Ireland 1 23 18 21 15 78
47 Slovak Republic 1 12 12 20 28 73
48 Morocco . 2 12 21 31 66
49 Saudi Arabia 9 9 9 5 28 60
50 Bulgaria 6 5 12 12 23 58
51 Jordan 2 2 13 24 14 55

Number of publications, full counts


Bar chart of publication_year

Share of the total number of publications in the field, full counts (%)

Obs Country 1990-1994 1995-1999 2000-2004 2005-2009 2010-2014 All years
1 All countries 100.0 100.0 100.0 100.0 100.0 100.0
2 United States 23.0 19.7 18.0 12.7 9.3 14.2
3 China 2.3 3.2 6.6 12.8 22.2 13.0
4 Spain 3.9 6.4 7.2 8.7 8.0 7.5
5 United Kingdom 10.5 9.6 9.6 6.0 4.5 6.9
6 Canada 11.6 9.1 6.2 6.2 4.8 6.6
7 Australia 3.8 5.4 6.9 6.0 5.9 5.8
8 India 6.3 5.1 4.0 5.0 5.3 5.1
9 France 3.9 4.2 5.8 4.5 3.9 4.4
10 Germany 5.8 5.3 4.4 3.8 3.2 4.1
11 Italy 2.4 3.9 3.5 4.0 3.4 3.6
12 Poland 2.5 2.7 3.4 3.2 3.1 3.1
13 Brazil 2.6 1.7 3.1 3.1 3.7 3.1
14 Japan 2.7 2.4 2.4 2.6 2.2 2.4
15 Turkey 1.0 0.5 2.5 2.8 2.8 2.3
16 Sweden 1.5 3.4 2.4 2.8 1.5 2.2
17 Portugal 1.0 0.6 1.2 2.8 2.5 2.0
18 Belgium 1.7 2.4 2.8 2.1 1.4 2.0
19 Netherlands 3.9 3.0 2.4 1.5 1.0 1.9
20 Korea, Republic of 0.1 0.9 1.5 2.1 2.6 1.9
21 Iran, Islamic Republic of 0.1 0.2 0.3 0.8 4.1 1.8
22 Finland 1.6 2.6 1.6 1.9 1.4 1.7
23 Russian Federation 0.9 1.4 1.8 1.6 1.4 1.5
24 Mexico 0.3 0.6 1.8 1.9 1.6 1.5
25 Czech Republic 0.4 1.0 1.2 1.3 1.6 1.3
26 Greece 0.5 1.8 1.0 1.4 1.1 1.2
27 New Zealand 1.3 1.1 1.3 1.0 0.7 1.0
28 South Africa 1.0 0.7 0.9 1.0 1.1 1.0
29 Egypt 0.5 1.0 0.3 0.8 1.3 0.9
30 Nigeria 0.5 0.3 0.5 1.2 1.2 0.9
31 Malaysia 0.6 0.6 0.4 0.8 1.3 0.9
32 Pakistan 0.2 0.2 0.4 0.8 1.5 0.9
33 Norway 0.8 1.4 0.9 0.8 0.5 0.8
34 Taiwan 0.8 0.9 0.7 0.5 1.0 0.8
35 Denmark 0.5 0.9 0.9 0.9 0.6 0.7
36 Switzerland 0.7 0.7 0.8 1.0 0.4 0.7
37 Chile 0.4 0.5 0.2 0.9 0.9 0.7
38 Argentina . 0.4 0.8 0.8 0.8 0.7
39 Slovenia 0.2 0.2 0.5 0.8 0.8 0.6
40 Hungary 0.5 0.7 0.7 0.8 0.4 0.6
41 Romania . 0.1 0.4 0.5 1.1 0.6
42 Austria 0.5 0.4 0.5 0.7 0.6 0.6
43 Republic of Serbia . . . 0.6 1.2 0.6
44 Thailand 0.6 0.1 0.8 0.8 0.5 0.6
45 Croatia 0.1 0.7 0.4 0.6 0.7 0.6
46 Ireland 0.1 1.2 0.7 0.5 0.3 0.5
47 Slovak Republic 0.1 0.6 0.5 0.5 0.5 0.5
48 Morocco . 0.1 0.5 0.5 0.6 0.4
49 Saudi Arabia 0.7 0.5 0.4 0.1 0.5 0.4
50 Bulgaria 0.5 0.3 0.5 0.3 0.4 0.4
51 Jordan 0.2 0.1 0.5 0.6 0.3 0.4

Share of the total number of publications in the field, full counts (%)


Bar chart of publication_year

Number of publications among 10% most cited in field, full counts

Obs Country 1990-1994 1995-1999 2000-2004 2005-2009 2010-2014 All years
1 All countries 156.3 286.9 330.8 395.5 447.2 1616.7
2 United States 56.2 80.5 76.2 42.8 35.5 291.2
3 China 1.7 5.3 32.2 87.7 179.0 305.8
4 Spain 8.3 34.3 46.0 46.4 35.6 170.6
5 United Kingdom 24.7 43.8 43.3 27.7 19.9 159.5
6 Canada 18.1 23.0 18.7 21.0 29.7 110.4
7 Australia 3.7 10.3 14.7 25.8 23.9 78.3
8 India 3.7 12.1 14.2 22.5 22.6 75.0
9 France 7.0 22.1 32.3 22.2 29.0 112.6
10 Germany 10.5 20.6 19.8 17.3 16.4 84.6
11 Italy 5.0 14.5 17.5 33.1 16.5 86.6
12 Poland 2.3 9.0 15.3 0.4 7.8 34.8
13 Brazil 0.0 4.5 7.3 6.2 5.6 23.6
14 Japan 3.0 2.2 4.2 5.7 10.5 25.6
15 Turkey 1.5 1.0 8.5 8.3 9.1 28.4
16 Sweden 4.5 10.5 6.7 16.0 5.8 43.5
17 Portugal 0.9 2.8 5.0 14.5 7.6 30.7
18 Belgium 8.1 13.8 13.5 15.2 7.3 57.8
19 Netherlands 8.7 11.3 8.5 9.4 11.2 49.1
20 Korea, Republic of 0.0 1.3 2.0 5.5 13.8 22.5
21 Iran, Islamic Republic of 0.0 0.0 0.5 3.3 19.1 22.8
22 Finland 1.5 3.7 5.1 3.7 0.0 13.9
23 Russian Federation 0.0 0.0 2.0 1.7 0.9 4.6
24 Mexico 0.3 0.0 5.3 5.4 1.0 12.0
25 Czech Republic 0.0 2.0 1.5 7.7 7.8 19.0
26 Greece 0.0 2.3 5.1 4.3 7.6 19.4
27 New Zealand 4.8 7.3 5.3 1.1 0.3 18.8
28 South Africa 0.0 0.8 4.6 1.3 0.7 7.4
29 Egypt 0.0 1.0 1.0 1.0 9.7 12.7
30 Nigeria 0.0 0.0 1.0 2.6 0.0 3.6
31 Malaysia 1.0 0.0 0.3 1.0 4.4 6.7
32 Pakistan 0.0 0.0 1.0 7.1 9.1 17.2
33 Norway 0.0 7.8 8.0 6.0 4.8 26.6
34 Taiwan 0.0 1.0 4.8 2.8 6.5 15.2
35 Denmark 0.8 1.0 2.0 1.0 4.0 8.8
36 Switzerland 3.0 2.0 6.0 2.5 1.7 15.1
37 Chile 0.0 1.5 1.0 3.0 1.7 7.2
38 Argentina . 0.0 4.5 1.2 2.3 8.0
39 Slovenia 0.0 0.0 0.0 7.1 2.5 9.6
40 Hungary 0.0 0.0 2.0 4.0 2.3 8.3
41 Romania . 0.3 1.0 0.0 0.3 1.6
42 Austria 1.0 3.0 4.3 6.6 5.8 20.7
43 Republic of Serbia . . . 4.6 1.6 6.2
44 Thailand 0.5 1.0 0.3 0.0 0.0 1.8
45 Croatia 0.0 0.0 1.0 1.0 4.3 6.3
46 Ireland 0.0 5.0 2.0 1.0 3.9 11.9
47 Slovak Republic 0.0 0.0 0.0 2.0 1.7 3.7
48 Morocco . 0.0 1.0 1.3 0.0 2.3
49 Saudi Arabia 0.0 0.0 0.0 1.3 4.4 5.7
50 Bulgaria 0.0 0.0 0.3 0.0 0.4 0.7
51 Jordan 0.0 1.0 1.3 3.5 1.3 7.1

Number of publications among 10% most cited in field, full counts


Bar chart of publication_year

Share of publications among 10% most cited in field, fractionalized (%)

Obs Country 1990-1994 1995-1999 2000-2004 2005-2009 2010-2014 All years
1 All countries 11.9 15.3 13.0 10.1 8.3 10.8
2 United States 19.2 20.7 14.9 7.2 5.8 13.1
3 China 5.4 7.9 19.0 17.3 15.1 15.6
4 Spain 12.2 25.5 25.1 13.8 8.3 15.0
5 United Kingdom 15.8 23.0 14.2 10.4 6.0 13.6
6 Canada 12.4 13.1 9.6 7.0 9.9 10.3
7 Australia 7.8 9.5 7.9 9.7 6.5 8.1
8 India 3.1 8.4 11.5 10.9 8.2 8.8
9 France 14.6 24.2 19.6 11.4 15.4 16.3
10 Germany 13.0 18.4 13.0 10.3 7.8 12.1
11 Italy 7.0 15.3 17.5 19.6 8.8 14.1
12 Poland 6.2 14.0 13.3 0.2 4.2 5.8
13 Brazil 0.0 11.7 5.1 3.8 2.8 3.8
14 Japan 8.9 4.4 6.5 3.7 5.8 5.5
15 Turkey 11.5 11.1 13.1 7.8 5.6 8.0
16 Sweden 20.9 13.8 7.4 15.2 3.6 11.6
17 Portugal 7.6 23.2 14.8 10.9 4.7 8.8
18 Belgium 33.9 27.3 11.3 15.5 7.8 15.9
19 Netherlands 18.8 18.7 9.2 15.5 17.8 15.9
20 Korea, Republic of 0.0 8.1 5.5 7.9 9.0 8.0
21 Iran, Islamic Republic of 0.0 0.0 3.8 11.4 8.4 8.5
22 Finland 4.4 5.7 6.4 4.8 0.0 3.9
23 Russian Federation 0.0 0.0 1.8 1.0 0.5 0.8
24 Mexico 8.5 0.0 8.7 8.6 1.4 5.2
25 Czech Republic 0.0 8.3 4.7 13.7 5.6 7.7
26 Greece 0.0 7.3 21.0 7.9 13.3 11.0
27 New Zealand 25.3 36.4 8.4 3.9 0.1 11.9
28 South Africa 0.0 5.6 19.2 2.5 1.6 4.7
29 Egypt 0.0 2.1 13.6 3.7 11.4 7.6
30 Nigeria 0.0 0.0 4.0 5.1 0.0 2.3
31 Malaysia 13.3 0.0 1.3 2.4 6.0 4.7
32 Pakistan 0.0 0.0 5.3 23.2 6.2 10.6
33 Norway 0.0 25.6 28.2 16.2 13.5 19.0
34 Taiwan 0.0 6.4 26.1 14.0 7.3 11.0
35 Denmark 7.5 7.1 10.7 2.2 11.7 7.8
36 Switzerland 25.6 15.8 31.9 4.8 8.9 14.6
37 Chile 0.0 15.4 4.8 10.9 3.0 6.8
38 Argentina . 0.0 28.7 4.7 6.3 9.6
39 Slovenia 0.0 0.0 0.0 20.3 5.6 8.6
40 Hungary 0.0 0.0 10.3 10.4 9.1 7.5
41 Romania . 13.3 5.8 0.0 0.2 0.7
42 Austria 18.2 29.6 19.8 16.6 17.2 18.6
43 Republic of Serbia . . . 21.1 2.7 7.7
44 Thailand 7.1 50.0 0.8 0.0 0.0 1.5
45 Croatia 0.0 0.0 10.1 4.9 10.7 7.1
46 Ireland 0.0 22.7 11.1 6.3 21.3 15.3
47 Slovak Republic 0.0 0.0 0.0 11.3 7.4 5.9
48 Morocco . 0.0 10.3 10.3 0.0 5.4
49 Saudi Arabia 0.0 0.0 0.0 36.4 12.1 7.0
50 Bulgaria 0.0 0.0 4.1 0.0 1.9 1.5
51 Jordan 0.0 66.7 10.9 11.9 5.7 11.5

Share of publications among 10% most cited in field, fractionalized (%)


Bar chart of publication_year

Field normalized citation rate (cf), fractionalized

Obs Country 1990-1994 1995-1999 2000-2004 2005-2009 2010-2014 All years
1 All countries 1.22 1.36 1.17 1.00 0.90 1.06
2 United States 1.65 1.74 1.29 0.86 0.82 1.24
3 China 0.50 0.82 1.55 1.33 1.25 1.27
4 Spain 1.36 1.83 1.74 1.31 1.01 1.33
5 United Kingdom 1.50 1.88 1.31 1.21 0.86 1.33
6 Canada 1.34 1.39 1.11 0.95 0.97 1.14
7 Australia 1.00 1.00 0.99 1.00 0.93 0.97
8 India 0.77 0.81 1.10 1.02 0.85 0.91
9 France 1.19 1.75 1.25 1.07 1.24 1.26
10 Germany 1.36 1.86 1.15 1.02 0.83 1.20
11 Italy 1.40 1.12 1.59 1.29 1.06 1.24
12 Poland 0.66 1.23 0.99 0.43 0.51 0.65
13 Brazil 0.61 0.78 0.68 0.56 0.43 0.54
14 Japan 1.15 0.74 0.72 0.70 0.67 0.75
15 Turkey 0.99 0.97 1.02 0.79 0.87 0.88
16 Sweden 1.54 1.43 0.97 1.29 0.81 1.18
17 Portugal 0.69 1.65 1.18 1.10 0.89 1.02
18 Belgium 2.91 2.36 1.40 1.32 1.00 1.55
19 Netherlands 1.59 1.44 1.28 1.20 1.27 1.37
20 Korea, Republic of 0.22 1.17 0.78 0.94 0.91 0.91
21 Iran, Islamic Republic of 1.07 0.55 0.71 1.03 0.86 0.87
22 Finland 0.79 0.83 1.00 0.64 0.59 0.73
23 Russian Federation 0.18 0.14 0.32 0.26 0.31 0.27
24 Mexico 0.87 0.70 0.96 0.88 0.49 0.73
25 Czech Republic 0.45 0.88 0.64 1.18 0.84 0.89
26 Greece 0.28 1.00 1.66 0.99 1.11 1.10
27 New Zealand 2.12 1.85 1.17 1.04 0.60 1.25
28 South Africa 0.65 0.86 1.04 0.57 0.52 0.66
29 Egypt 0.30 0.57 0.70 0.62 0.88 0.72
30 Nigeria 0.66 0.83 0.57 0.65 0.41 0.55
31 Malaysia 1.20 0.44 0.70 0.55 0.71 0.68
32 Pakistan 0.16 0.12 0.36 1.36 0.85 0.92
33 Norway 0.88 1.62 2.36 1.77 1.19 1.65
34 Taiwan 0.50 1.25 1.42 1.41 1.00 1.13
35 Denmark 1.00 0.96 1.14 0.91 1.14 1.04
36 Switzerland 2.15 1.59 1.88 1.06 0.81 1.37
37 Chile 0.27 0.81 0.42 0.69 0.79 0.70
38 Argentina . 0.74 1.36 0.86 0.91 0.97
39 Slovenia 0.11 0.70 0.55 1.21 0.69 0.80
40 Hungary 0.33 0.69 0.72 0.79 0.82 0.73
41 Romania . 1.62 1.05 0.28 0.36 0.41
42 Austria 0.52 2.63 2.05 1.64 1.47 1.62
43 Republic of Serbia . . . 1.65 0.57 0.86
44 Thailand 0.70 3.43 0.79 0.57 0.50 0.66
45 Croatia 1.04 0.58 1.33 0.53 0.81 0.77
46 Ireland 1.48 1.41 0.97 1.04 1.59 1.24
47 Slovak Republic 0.03 0.31 0.30 0.89 0.59 0.57
48 Morocco . 0.24 0.76 0.91 0.48 0.66
49 Saudi Arabia 0.38 0.22 0.19 1.51 1.17 0.66
50 Bulgaria 0.19 0.34 0.97 0.32 0.39 0.45
51 Jordan 0.92 2.58 0.95 0.89 0.76 0.93

Field normalized citation rate (cf), fractionalized


Bar chart of publication_year