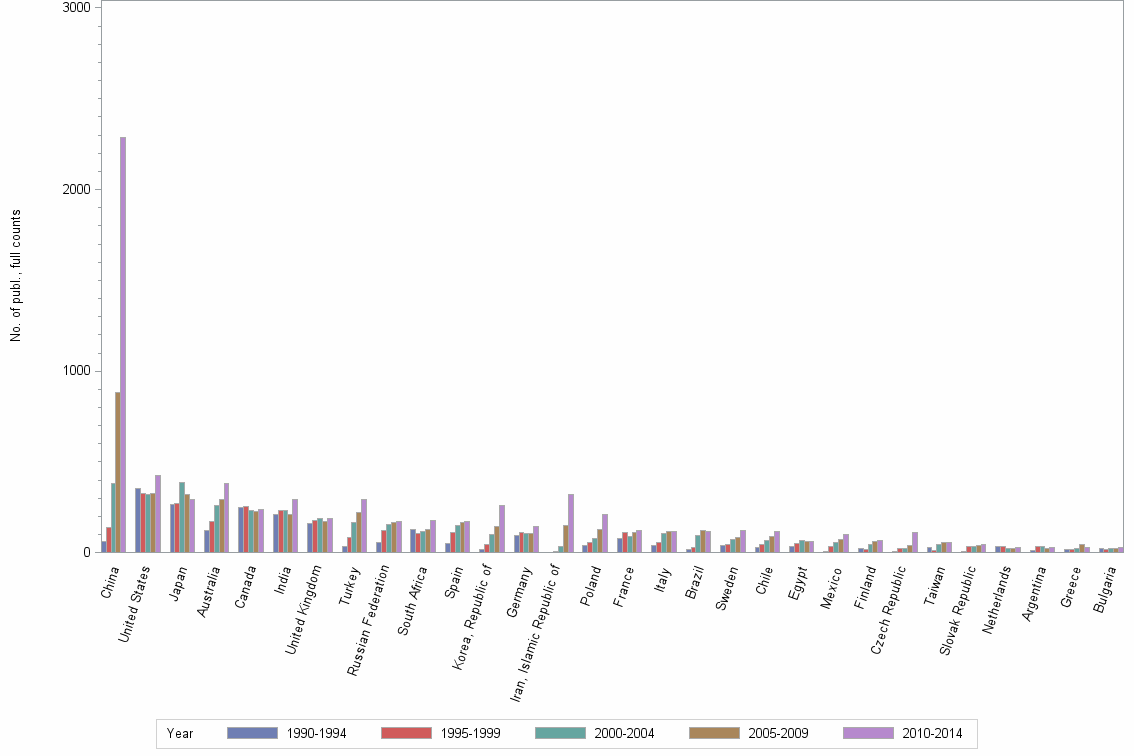
Lev4: METALLURGY & METALLURGICAL ENGINEERING//MATERIALS SCIENCE, MULTIDISCIPLINARY//ENGINEERING, MECHANICAL - Statistics for Countries

Statistics per Country

Number of publications, full counts

Obs Country 1990-1994 1995-1999 2000-2004 2005-2009 2010-2014 All years
1 All countries 2324 2737 3548 4410 6524 19543
2 China 62 139 384 880 2289 3754
3 United States 354 324 322 325 427 1752
4 Japan 267 272 389 322 294 1544
5 Australia 125 173 258 294 384 1234
6 Canada 251 255 235 228 236 1205
7 India 209 231 232 213 293 1178
8 United Kingdom 161 176 186 173 187 883
9 Turkey 35 84 169 219 294 801
10 Russian Federation 54 125 156 165 170 670
11 South Africa 129 105 119 129 178 660
12 Spain 50 113 150 165 173 651
13 Korea, Republic of 18 44 103 142 259 566
14 Germany 97 110 108 104 143 562
15 Iran, Islamic Republic of . 9 32 150 321 512
16 Poland 39 54 80 126 213 512
17 France 77 111 90 111 120 509
18 Italy 42 55 105 119 115 436
19 Brazil 19 29 93 120 119 380
20 Sweden 39 47 72 83 123 364
21 Chile 30 43 65 90 119 347
22 Egypt 36 49 67 64 62 278
23 Mexico 5 32 55 75 98 265
24 Finland 22 20 45 64 66 217
25 Czech Republic 5 22 25 42 110 204
26 Taiwan 28 15 43 59 58 203
27 Slovak Republic 9 33 33 38 47 160
28 Netherlands 32 37 25 22 27 143
29 Argentina 15 33 36 24 27 135
30 Greece 18 19 21 46 28 132
31 Bulgaria 24 16 23 22 29 114
32 Singapore 2 7 33 35 33 110
33 Romania 1 7 13 31 56 108
34 Austria 9 13 18 25 39 104
35 Switzerland 9 22 18 14 27 90
36 Portugal 6 10 13 32 24 85
37 Republic of Serbia . . . 18 60 78
38 Norway 2 9 11 19 36 77
39 USSR 73 . . . . 73
40 Belgium 6 15 13 12 24 70
41 Ukraine 6 9 14 14 13 56
42 Saudi Arabia 7 3 9 10 24 53
43 Israel 3 7 12 17 10 49
44 Malaysia 1 1 4 7 36 49
45 Pakistan 5 2 1 16 23 47
46 Yugoslavia 6 22 15 1 . 44
47 Nigeria 3 8 5 11 14 41
48 Algeria 3 5 7 11 11 37
49 Croatia . 1 3 9 22 35
50 Slovenia . 1 5 7 20 33
51 Colombia 1 4 2 13 12 32
52 Czechoslovakia 32 . . . . 32

Number of publications, full counts


Bar chart of publication_year

Share of the total number of publications in the field, full counts (%)

Obs Country 1990-1994 1995-1999 2000-2004 2005-2009 2010-2014 All years
1 All countries 100.0 100.0 100.0 100.0 100.0 100.0
2 China 2.7 5.1 10.8 20.0 35.1 19.2
3 United States 15.2 11.8 9.1 7.4 6.5 9.0
4 Japan 11.5 9.9 11.0 7.3 4.5 7.9
5 Australia 5.4 6.3 7.3 6.7 5.9 6.3
6 Canada 10.8 9.3 6.6 5.2 3.6 6.2
7 India 9.0 8.4 6.5 4.8 4.5 6.0
8 United Kingdom 6.9 6.4 5.2 3.9 2.9 4.5
9 Turkey 1.5 3.1 4.8 5.0 4.5 4.1
10 Russian Federation 2.3 4.6 4.4 3.7 2.6 3.4
11 South Africa 5.6 3.8 3.4 2.9 2.7 3.4
12 Spain 2.2 4.1 4.2 3.7 2.7 3.3
13 Korea, Republic of 0.8 1.6 2.9 3.2 4.0 2.9
14 Germany 4.2 4.0 3.0 2.4 2.2 2.9
15 Iran, Islamic Republic of . 0.3 0.9 3.4 4.9 2.6
16 Poland 1.7 2.0 2.3 2.9 3.3 2.6
17 France 3.3 4.1 2.5 2.5 1.8 2.6
18 Italy 1.8 2.0 3.0 2.7 1.8 2.2
19 Brazil 0.8 1.1 2.6 2.7 1.8 1.9
20 Sweden 1.7 1.7 2.0 1.9 1.9 1.9
21 Chile 1.3 1.6 1.8 2.0 1.8 1.8
22 Egypt 1.5 1.8 1.9 1.5 1.0 1.4
23 Mexico 0.2 1.2 1.6 1.7 1.5 1.4
24 Finland 0.9 0.7 1.3 1.5 1.0 1.1
25 Czech Republic 0.2 0.8 0.7 1.0 1.7 1.0
26 Taiwan 1.2 0.5 1.2 1.3 0.9 1.0
27 Slovak Republic 0.4 1.2 0.9 0.9 0.7 0.8
28 Netherlands 1.4 1.4 0.7 0.5 0.4 0.7
29 Argentina 0.6 1.2 1.0 0.5 0.4 0.7
30 Greece 0.8 0.7 0.6 1.0 0.4 0.7
31 Bulgaria 1.0 0.6 0.6 0.5 0.4 0.6
32 Singapore 0.1 0.3 0.9 0.8 0.5 0.6
33 Romania 0.0 0.3 0.4 0.7 0.9 0.6
34 Austria 0.4 0.5 0.5 0.6 0.6 0.5
35 Switzerland 0.4 0.8 0.5 0.3 0.4 0.5
36 Portugal 0.3 0.4 0.4 0.7 0.4 0.4
37 Republic of Serbia . . . 0.4 0.9 0.4
38 Norway 0.1 0.3 0.3 0.4 0.6 0.4
39 USSR 3.1 . . . . 0.4
40 Belgium 0.3 0.5 0.4 0.3 0.4 0.4
41 Ukraine 0.3 0.3 0.4 0.3 0.2 0.3
42 Saudi Arabia 0.3 0.1 0.3 0.2 0.4 0.3
43 Israel 0.1 0.3 0.3 0.4 0.2 0.3
44 Malaysia 0.0 0.0 0.1 0.2 0.6 0.3
45 Pakistan 0.2 0.1 0.0 0.4 0.4 0.2
46 Yugoslavia 0.3 0.8 0.4 0.0 . 0.2
47 Nigeria 0.1 0.3 0.1 0.2 0.2 0.2
48 Algeria 0.1 0.2 0.2 0.2 0.2 0.2
49 Croatia . 0.0 0.1 0.2 0.3 0.2
50 Slovenia . 0.0 0.1 0.2 0.3 0.2
51 Colombia 0.0 0.1 0.1 0.3 0.2 0.2
52 Czechoslovakia 1.4 . . . . 0.2

Share of the total number of publications in the field, full counts (%)


Bar chart of publication_year

Number of publications among 10% most cited in field, full counts

Obs Country 1990-1994 1995-1999 2000-2004 2005-2009 2010-2014 All years
1 All countries 217.5 232.9 314.1 348.9 423.8 1537.3
2 China 4.5 4.8 14.2 65.5 172.7 261.7
3 United States 51.6 33.4 30.7 28.4 37.8 181.9
4 Japan 19.8 28.0 28.4 15.4 9.8 101.4
5 Australia 19.9 15.5 34.5 37.6 39.1 146.5
6 Canada 32.9 30.0 25.8 24.5 18.2 131.5
7 India 13.3 12.8 13.0 16.9 13.9 69.9
8 United Kingdom 19.6 18.6 26.1 17.1 22.9 104.3
9 Turkey 4.3 7.8 17.0 25.6 12.4 67.2
10 Russian Federation 2.0 2.5 6.5 2.1 0.7 13.8
11 South Africa 14.4 8.6 11.2 9.0 10.3 53.7
12 Spain 10.0 15.2 19.8 17.2 14.1 76.4
13 Korea, Republic of 6.0 4.0 14.5 11.5 18.8 54.8
14 Germany 8.7 18.4 12.0 9.0 17.6 65.7
15 Iran, Islamic Republic of . 3.0 2.3 13.8 26.3 45.4
16 Poland 2.0 3.2 1.0 3.4 7.8 17.4
17 France 3.5 4.7 7.3 15.8 11.1 42.4
18 Italy 5.0 7.4 21.4 19.9 10.0 63.7
19 Brazil 0.0 1.1 6.2 9.4 8.3 24.9
20 Sweden 2.5 6.9 6.7 8.6 9.9 34.7
21 Chile 1.8 6.2 8.0 10.1 10.4 36.4
22 Egypt 2.0 4.7 8.3 7.7 3.5 26.3
23 Mexico 0.0 3.7 4.3 3.2 0.1 11.2
24 Finland 2.3 1.8 0.0 5.0 2.8 11.9
25 Czech Republic 0.0 1.0 2.0 3.3 8.4 14.6
26 Taiwan 2.0 1.5 3.0 4.5 5.0 16.0
27 Slovak Republic 1.4 4.1 4.0 5.3 1.0 15.9
28 Netherlands 4.0 4.0 1.3 1.3 0.7 11.3
29 Argentina 0.5 0.0 2.7 0.5 0.7 4.4
30 Greece 5.2 2.2 2.7 6.0 2.8 18.9
31 Bulgaria 1.0 1.3 2.0 2.0 0.0 6.3
32 Singapore 0.0 0.7 1.3 7.4 5.5 14.9
33 Romania 0.0 1.0 0.0 0.0 0.3 1.3
34 Austria 1.0 0.0 0.5 0.5 1.1 3.1
35 Switzerland 0.0 3.0 0.0 2.2 4.3 9.6
36 Portugal 1.0 1.0 3.0 6.5 0.7 12.2
37 Republic of Serbia . . . 0.6 0.0 0.6
38 Norway 0.0 0.0 3.0 2.5 4.0 9.5
39 USSR 0.0 . . . . 0.0
40 Belgium 1.0 0.8 0.0 0.0 3.1 4.8
41 Ukraine 0.0 0.5 0.0 0.0 0.0 0.5
42 Saudi Arabia 0.0 0.0 2.0 0.0 4.0 6.0
43 Israel 0.5 0.5 2.0 0.7 0.5 4.2
44 Malaysia 0.0 0.0 0.0 0.8 2.7 3.5
45 Pakistan 0.0 0.0 0.0 0.0 2.2 2.2
46 Yugoslavia 3.1 1.0 3.0 0.0 . 7.1
47 Nigeria 0.0 1.0 0.3 0.0 0.0 1.3
48 Algeria 0.0 0.0 1.5 0.5 0.0 2.0
49 Croatia . 0.0 1.0 0.0 0.5 1.5
50 Slovenia . 0.0 1.5 0.0 0.3 1.8
51 Colombia 0.0 0.0 0.0 4.0 0.0 4.0
52 Czechoslovakia 3.8 . . . . 3.8

Number of publications among 10% most cited in field, full counts


Bar chart of publication_year

Share of publications among 10% most cited in field, fractionalized (%)

Obs Country 1990-1994 1995-1999 2000-2004 2005-2009 2010-2014 All years
1 All countries 9.4 8.5 8.9 7.9 6.5 7.9
2 China 6.1 3.7 3.0 7.3 7.3 6.7
3 United States 14.2 9.1 10.3 7.7 8.7 10.1
4 Japan 7.3 10.4 7.3 4.6 2.8 6.5
5 Australia 15.6 9.4 14.7 12.6 9.1 12.0
6 Canada 11.8 11.5 12.2 10.1 8.0 10.8
7 India 6.6 5.3 5.8 7.9 4.2 5.9
8 United Kingdom 11.6 10.5 12.9 10.4 11.7 11.4
9 Turkey 8.9 9.0 10.5 10.7 3.8 8.0
10 Russian Federation 1.9 2.0 3.5 0.8 0.4 1.7
11 South Africa 10.0 8.1 8.5 5.4 5.4 7.4
12 Spain 17.7 12.6 12.2 8.6 7.2 10.6
13 Korea, Republic of 23.8 9.0 14.8 7.3 7.3 9.4
14 Germany 8.9 15.9 9.6 8.1 11.6 10.8
15 Iran, Islamic Republic of . 29.4 6.7 9.4 8.0 8.7
16 Poland 4.1 5.0 1.3 2.8 3.0 3.0
17 France 4.8 3.8 10.3 13.4 8.7 8.1
18 Italy 12.8 13.4 21.9 14.8 9.2 14.8
19 Brazil 0.0 4.2 6.8 8.2 7.1 6.8
20 Sweden 5.9 14.6 8.6 12.4 6.8 9.3
21 Chile 5.6 10.6 9.2 9.5 7.1 8.4
22 Egypt 6.0 9.9 12.7 12.8 6.5 10.1
23 Mexico 0.0 9.7 8.8 4.0 0.0 4.1
24 Finland 11.5 7.2 0.0 6.4 3.7 4.7
25 Czech Republic 0.0 5.5 3.3 8.2 7.5 6.8
26 Taiwan 5.6 6.9 7.6 7.3 6.6 6.9
27 Slovak Republic 9.7 13.7 12.9 12.9 1.7 10.0
28 Netherlands 11.3 10.9 6.0 1.7 2.1 7.7
29 Argentina 3.3 0.0 5.8 2.3 2.8 2.9
30 Greece 29.9 11.6 12.4 10.2 11.1 13.8
31 Bulgaria 4.7 6.8 7.8 9.5 0.0 5.2
32 Singapore 0.0 9.5 3.7 27.2 14.6 14.5
33 Romania 0.0 9.1 0.0 0.0 0.3 0.7
34 Austria 11.5 0.0 3.0 0.6 1.3 2.3
35 Switzerland 0.0 13.6 0.2 14.3 15.0 9.8
36 Portugal 10.0 10.0 27.3 16.3 2.6 13.3
37 Republic of Serbia . . . 3.4 0.0 0.8
38 Norway 0.0 0.0 15.1 16.9 12.7 11.7
39 USSR 0.0 . . . . 0.0
40 Belgium 16.7 5.4 0.0 0.0 14.2 7.5
41 Ukraine 0.0 6.3 0.0 0.0 0.0 1.0
42 Saudi Arabia 0.0 0.0 25.0 0.0 16.9 11.1
43 Israel 20.0 9.1 20.8 2.2 5.9 9.0
44 Malaysia 0.0 0.0 0.0 11.9 10.5 9.2
45 Pakistan 0.0 0.0 0.0 0.0 9.8 4.3
46 Yugoslavia 49.6 4.8 18.9 0.0 . 14.8
47 Nigeria 0.0 14.6 6.7 0.0 0.0 4.0
48 Algeria 0.0 0.0 16.1 4.5 0.0 4.3
49 Croatia . 0.0 42.9 0.0 2.5 4.2
50 Slovenia . 0.0 20.0 0.0 2.5 4.6
51 Colombia 0.0 0.0 0.0 25.0 0.0 9.4
52 Czechoslovakia 9.9 . . . . 9.9

Share of publications among 10% most cited in field, fractionalized (%)


Bar chart of publication_year

Field normalized citation rate (cf), fractionalized

Obs Country 1990-1994 1995-1999 2000-2004 2005-2009 2010-2014 All years
1 All countries 0.93 0.88 0.89 0.87 0.80 0.86
2 China 0.58 0.50 0.53 0.84 0.86 0.81
3 United States 1.26 0.93 1.04 0.95 0.95 1.03
4 Japan 0.86 1.03 0.80 0.69 0.62 0.80
5 Australia 1.30 1.02 1.30 1.20 1.03 1.16
6 Canada 1.16 1.24 1.06 1.07 0.96 1.10
7 India 0.78 0.65 0.67 0.75 0.65 0.70
8 United Kingdom 1.04 1.05 1.11 1.06 1.08 1.07
9 Turkey 1.04 0.92 0.97 1.03 0.65 0.87
10 Russian Federation 0.23 0.26 0.34 0.20 0.25 0.26
11 South Africa 1.19 0.80 0.94 0.77 0.74 0.89
12 Spain 1.26 1.03 0.99 1.03 0.76 0.97
13 Korea, Republic of 1.56 1.15 0.97 0.93 0.80 0.91
14 Germany 0.82 1.17 1.32 0.88 1.11 1.06
15 Iran, Islamic Republic of . 1.89 0.78 1.04 0.87 0.93
16 Poland 0.54 0.59 0.43 0.49 0.63 0.55
17 France 0.63 0.69 0.97 1.11 0.95 0.87
18 Italy 1.15 1.30 1.64 1.35 1.00 1.31
19 Brazil 0.53 0.78 0.90 0.83 0.74 0.80
20 Sweden 0.99 1.21 1.15 1.10 0.88 1.04
21 Chile 0.69 1.09 0.82 1.15 0.74 0.90
22 Egypt 0.66 0.93 1.14 1.01 0.73 0.92
23 Mexico 0.43 0.90 1.04 0.78 0.41 0.70
24 Finland 0.97 0.83 0.63 0.91 0.74 0.79
25 Czech Republic 0.41 0.53 0.82 1.00 0.75 0.78
26 Taiwan 0.81 0.80 0.95 0.80 0.76 0.82
27 Slovak Republic 0.66 0.91 0.93 0.93 0.61 0.83
28 Netherlands 1.10 0.95 0.71 0.50 0.68 0.85
29 Argentina 0.60 0.59 0.68 0.45 0.56 0.58
30 Greece 1.51 1.04 1.04 0.98 1.35 1.15
31 Bulgaria 0.79 1.03 0.95 0.77 0.36 0.74
32 Singapore 0.17 0.91 0.81 1.57 1.37 1.19
33 Romania 0.34 0.68 0.13 0.10 0.32 0.26
34 Austria 1.13 0.52 0.73 0.63 0.75 0.73
35 Switzerland 0.26 1.23 0.82 1.60 1.39 1.11
36 Portugal 1.08 1.42 1.73 1.16 0.70 1.17
37 Republic of Serbia . . . 0.65 0.42 0.47
38 Norway 0.80 0.52 1.17 0.99 1.05 0.97
39 USSR 0.08 . . . . 0.08
40 Belgium 2.34 0.89 0.40 0.78 1.10 1.01
41 Ukraine 0.24 0.56 0.21 0.22 0.23 0.27
42 Saudi Arabia 0.49 0.64 1.34 0.51 1.61 1.07
43 Israel 0.94 0.73 1.77 0.68 0.93 0.99
44 Malaysia 1.44 0.18 0.53 0.92 1.12 1.00
45 Pakistan 0.24 0.17 0.34 0.20 0.69 0.43
46 Yugoslavia 1.83 0.61 1.13 0.24 . 0.92
47 Nigeria 0.00 0.82 0.80 1.06 0.66 0.75
48 Algeria 0.35 0.37 1.07 0.47 0.34 0.51
49 Croatia . 0.41 1.53 0.50 0.48 0.55
50 Slovenia . 0.24 0.90 0.23 0.41 0.44
51 Colombia 0.40 0.29 0.70 2.35 0.30 1.09
52 Czechoslovakia 0.65 . . . . 0.65

Field normalized citation rate (cf), fractionalized


Bar chart of publication_year