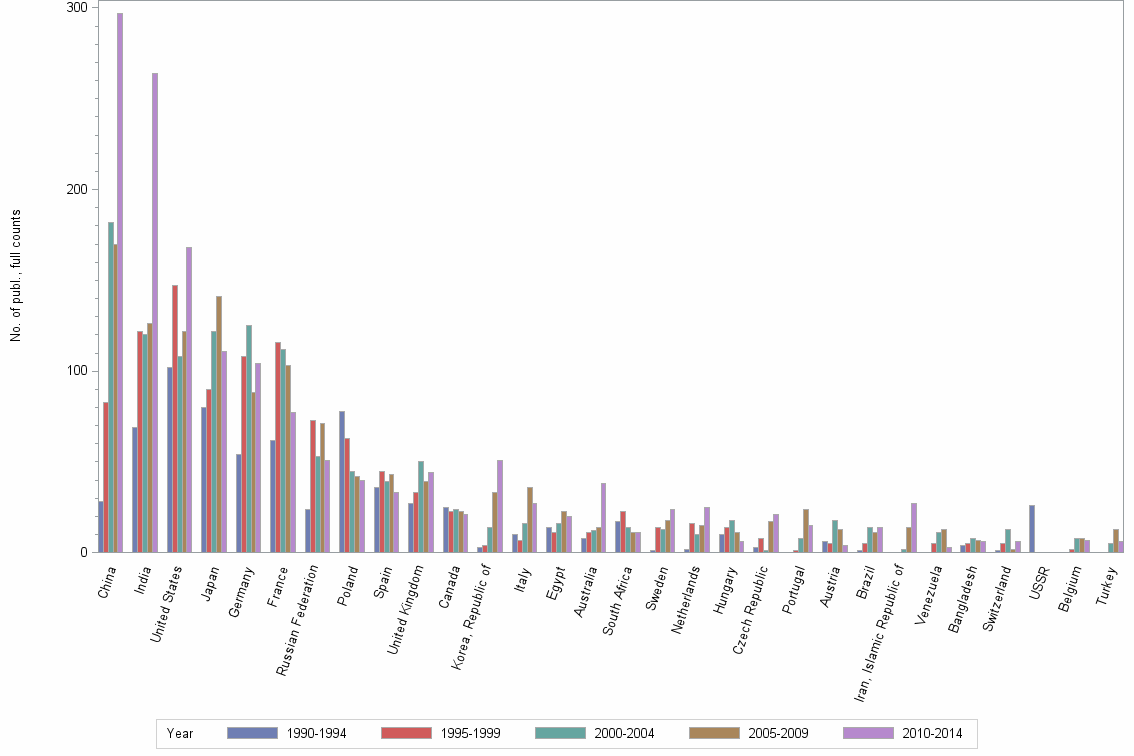
Lev4: CHEMISTRY, ORGANIC//CHEMISTRY, INORGANIC & NUCLEAR//CHEMISTRY, MULTIDISCIPLINARY - Statistics for Countries

Statistics per Country

Number of publications, full counts

Obs Country 1990-1994 1995-1999 2000-2004 2005-2009 2010-2014 All years
1 All countries 694 977 1055 1058 1360 5144
2 China 28 83 182 170 297 760
3 India 69 122 120 126 264 701
4 United States 102 147 108 122 168 647
5 Japan 80 90 122 141 111 544
6 Germany 54 108 125 88 104 479
7 France 62 116 112 103 77 470
8 Russian Federation 24 73 53 71 51 272
9 Poland 78 63 45 42 40 268
10 Spain 36 45 39 43 33 196
11 United Kingdom 27 33 50 39 44 193
12 Canada 25 23 24 23 21 116
13 Korea, Republic of 3 4 14 33 51 105
14 Italy 10 7 16 36 27 96
15 Egypt 14 11 16 23 20 84
16 Australia 8 11 12 14 38 83
17 South Africa 17 23 14 11 11 76
18 Sweden 1 14 13 18 24 70
19 Netherlands 2 16 10 15 25 68
20 Hungary 10 14 18 11 6 59
21 Czech Republic 3 8 1 17 21 50
22 Portugal . 1 8 24 15 48
23 Austria 6 5 18 13 4 46
24 Brazil 1 5 14 11 14 45
25 Iran, Islamic Republic of . . 2 14 27 43
26 Venezuela . 5 11 13 3 32
27 Bangladesh 4 5 8 7 6 30
28 Switzerland 1 5 13 2 6 27
29 USSR 26 . . . . 26
30 Belgium . 2 8 8 7 25
31 Turkey . . 5 13 6 24
32 Bulgaria 4 6 8 5 . 23
33 Malaysia . . 10 8 5 23
34 Taiwan 15 1 1 3 3 23
35 Algeria 5 2 3 6 5 21
36 Israel 6 1 2 3 9 21
37 New Zealand 2 8 4 . 1 15
38 Greece . . 3 5 5 13
39 Ukraine 2 4 3 1 3 13
40 Finland 4 1 2 2 2 11
41 Chile . 2 4 2 2 10
42 Cuba . 1 7 2 . 10
43 Czechoslovakia 9 . . . . 9
44 Mexico 1 4 2 1 1 9
45 Morocco 1 3 3 . 1 8
46 Saudi Arabia . . 1 1 6 8
47 Argentina . 3 2 1 . 6
48 Pakistan . 1 . 2 3 6
49 Thailand . . 1 3 2 6
50 Denmark . 1 3 1 . 5
51 Norway 3 1 1 . . 5
52 Romania 1 . 1 . 3 5

Number of publications, full counts


Bar chart of publication_year

Share of the total number of publications in the field, full counts (%)

Obs Country 1990-1994 1995-1999 2000-2004 2005-2009 2010-2014 All years
1 All countries 100.0 100.0 100.0 100.0 100.0 100.0
2 China 4.0 8.5 17.3 16.1 21.8 14.8
3 India 9.9 12.5 11.4 11.9 19.4 13.6
4 United States 14.7 15.0 10.2 11.5 12.4 12.6
5 Japan 11.5 9.2 11.6 13.3 8.2 10.6
6 Germany 7.8 11.1 11.8 8.3 7.6 9.3
7 France 8.9 11.9 10.6 9.7 5.7 9.1
8 Russian Federation 3.5 7.5 5.0 6.7 3.8 5.3
9 Poland 11.2 6.4 4.3 4.0 2.9 5.2
10 Spain 5.2 4.6 3.7 4.1 2.4 3.8
11 United Kingdom 3.9 3.4 4.7 3.7 3.2 3.8
12 Canada 3.6 2.4 2.3 2.2 1.5 2.3
13 Korea, Republic of 0.4 0.4 1.3 3.1 3.8 2.0
14 Italy 1.4 0.7 1.5 3.4 2.0 1.9
15 Egypt 2.0 1.1 1.5 2.2 1.5 1.6
16 Australia 1.2 1.1 1.1 1.3 2.8 1.6
17 South Africa 2.4 2.4 1.3 1.0 0.8 1.5
18 Sweden 0.1 1.4 1.2 1.7 1.8 1.4
19 Netherlands 0.3 1.6 0.9 1.4 1.8 1.3
20 Hungary 1.4 1.4 1.7 1.0 0.4 1.1
21 Czech Republic 0.4 0.8 0.1 1.6 1.5 1.0
22 Portugal . 0.1 0.8 2.3 1.1 0.9
23 Austria 0.9 0.5 1.7 1.2 0.3 0.9
24 Brazil 0.1 0.5 1.3 1.0 1.0 0.9
25 Iran, Islamic Republic of . . 0.2 1.3 2.0 0.8
26 Venezuela . 0.5 1.0 1.2 0.2 0.6
27 Bangladesh 0.6 0.5 0.8 0.7 0.4 0.6
28 Switzerland 0.1 0.5 1.2 0.2 0.4 0.5
29 USSR 3.7 . . . . 0.5
30 Belgium . 0.2 0.8 0.8 0.5 0.5
31 Turkey . . 0.5 1.2 0.4 0.5
32 Bulgaria 0.6 0.6 0.8 0.5 . 0.4
33 Malaysia . . 0.9 0.8 0.4 0.4
34 Taiwan 2.2 0.1 0.1 0.3 0.2 0.4
35 Algeria 0.7 0.2 0.3 0.6 0.4 0.4
36 Israel 0.9 0.1 0.2 0.3 0.7 0.4
37 New Zealand 0.3 0.8 0.4 . 0.1 0.3
38 Greece . . 0.3 0.5 0.4 0.3
39 Ukraine 0.3 0.4 0.3 0.1 0.2 0.3
40 Finland 0.6 0.1 0.2 0.2 0.1 0.2
41 Chile . 0.2 0.4 0.2 0.1 0.2
42 Cuba . 0.1 0.7 0.2 . 0.2
43 Czechoslovakia 1.3 . . . . 0.2
44 Mexico 0.1 0.4 0.2 0.1 0.1 0.2
45 Morocco 0.1 0.3 0.3 . 0.1 0.2
46 Saudi Arabia . . 0.1 0.1 0.4 0.2
47 Argentina . 0.3 0.2 0.1 . 0.1
48 Pakistan . 0.1 . 0.2 0.2 0.1
49 Thailand . . 0.1 0.3 0.1 0.1
50 Denmark . 0.1 0.3 0.1 . 0.1
51 Norway 0.4 0.1 0.1 . . 0.1
52 Romania 0.1 . 0.1 . 0.2 0.1

Share of the total number of publications in the field, full counts (%)


Bar chart of publication_year

Number of publications among 10% most cited in field, full counts

Obs Country 1990-1994 1995-1999 2000-2004 2005-2009 2010-2014 All years
1 All countries 89.9 109.7 66.9 80.3 93.2 440.0
2 China 1.8 5.1 2.7 2.1 18.3 29.9
3 India 5.6 16.2 9.6 18.3 13.8 63.5
4 United States 29.8 21.0 11.5 12.3 10.3 85.0
5 Japan 4.3 8.2 13.1 8.7 4.2 38.4
6 Germany 11.0 22.2 7.7 13.5 15.5 69.9
7 France 16.1 24.7 15.0 12.9 9.4 78.1
8 Russian Federation 0.0 0.0 0.0 2.8 0.5 3.3
9 Poland 0.0 3.3 1.0 0.3 2.9 7.5
10 Spain 3.0 5.0 2.0 4.7 4.0 18.7
11 United Kingdom 8.3 4.7 5.5 12.7 10.0 41.1
12 Canada 2.0 2.0 2.0 1.0 3.5 10.5
13 Korea, Republic of 0.0 0.0 0.0 4.3 5.8 10.1
14 Italy 0.3 0.0 3.0 3.7 3.7 10.7
15 Egypt 0.0 0.0 0.0 0.0 0.1 0.2
16 Australia 0.0 0.0 1.0 2.0 3.5 6.5
17 South Africa 3.0 3.0 1.0 1.0 0.0 8.0
18 Sweden 0.0 2.7 3.0 6.2 2.0 13.8
19 Netherlands 0.0 4.0 1.0 1.0 2.0 8.0
20 Hungary 3.0 5.9 1.0 0.0 0.0 9.9
21 Czech Republic 0.0 0.0 0.0 0.5 2.0 2.5
22 Portugal . 1.0 1.3 0.7 1.9 4.9
23 Austria 1.0 1.0 1.0 0.0 0.0 3.0
24 Brazil 0.0 0.3 1.0 0.6 3.7 5.5
25 Iran, Islamic Republic of . . 0.0 4.0 0.0 4.0
26 Venezuela . 1.0 0.0 0.0 0.0 1.0
27 Bangladesh 2.0 1.0 0.0 0.0 0.0 3.0
28 Switzerland 0.0 0.0 0.0 0.0 0.0 0.0
29 USSR 0.3 . . . . 0.3
30 Belgium . 0.0 0.3 1.0 3.0 4.3
31 Turkey . . 0.0 2.0 0.0 2.0
32 Bulgaria 1.0 0.0 0.0 0.0 . 1.0
33 Malaysia . . 1.0 0.0 0.0 1.0
34 Taiwan 0.0 0.0 0.0 0.0 0.0 0.0
35 Algeria 0.0 1.0 0.0 1.0 1.3 3.3
36 Israel 1.0 0.0 0.0 0.0 0.0 1.0
37 New Zealand 0.0 1.0 0.0 . 0.0 1.0
38 Greece . . 1.7 0.0 0.0 1.7
39 Ukraine 0.0 0.0 0.0 0.0 0.0 0.0
40 Finland 1.0 0.0 0.0 0.0 0.0 1.0
41 Chile . 1.0 0.0 0.0 0.0 1.0
42 Cuba . 0.0 0.0 0.0 . 0.0
43 Czechoslovakia 0.0 . . . . 0.0
44 Mexico 0.0 0.0 0.0 0.0 0.0 0.0
45 Morocco 0.0 0.0 0.0 . 0.0 0.0
46 Saudi Arabia . . 0.0 0.0 0.0 0.0
47 Argentina . 0.0 0.0 0.0 . 0.0
48 Pakistan . 0.0 . 0.0 0.0 0.0
49 Thailand . . 0.0 0.0 0.0 0.0
50 Denmark . 0.0 0.0 0.0 . 0.0
51 Norway 2.0 0.0 0.0 . . 2.0
52 Romania 1.0 . 0.0 . 0.0 1.0

Number of publications among 10% most cited in field, full counts


Bar chart of publication_year

Share of publications among 10% most cited in field, fractionalized (%)

Obs Country 1990-1994 1995-1999 2000-2004 2005-2009 2010-2014 All years
1 All countries 12.9 11.2 6.3 7.6 6.9 8.6
2 China 5.6 6.5 1.5 1.4 6.0 4.0
3 India 8.4 12.6 8.1 13.7 5.0 8.8
4 United States 30.4 13.3 11.2 10.1 5.9 13.3
5 Japan 5.6 7.8 10.6 6.7 3.6 7.0
6 Germany 20.5 19.8 5.2 12.1 15.3 13.8
7 France 30.1 19.4 13.1 9.1 9.3 15.7
8 Russian Federation 0.0 0.0 0.0 3.2 1.1 1.0
9 Poland 0.0 6.0 2.6 0.6 4.6 2.7
10 Spain 9.0 9.8 2.5 8.3 9.4 7.9
11 United Kingdom 32.2 8.1 6.6 26.8 28.4 19.0
12 Canada 9.5 9.2 8.9 6.3 17.7 10.1
13 Korea, Republic of 0.0 0.0 0.0 8.1 10.5 7.4
14 Italy 4.8 0.0 10.8 7.3 10.0 7.9
15 Egypt 0.0 0.0 0.2 0.0 0.8 0.2
16 Australia 0.0 0.0 9.2 17.9 10.1 8.8
17 South Africa 17.6 13.0 8.1 12.5 0.0 11.5
18 Sweden 0.0 8.6 10.0 31.4 5.9 11.7
19 Netherlands 0.0 26.1 6.7 2.9 4.2 11.5
20 Hungary 28.9 37.8 3.8 0.0 0.0 13.9
21 Czech Republic 0.0 0.0 0.0 4.0 3.2 2.6
22 Portugal . 100.0 16.3 2.1 7.1 7.2
23 Austria 21.4 13.6 1.6 0.0 0.0 4.9
24 Brazil 0.0 6.7 8.6 5.6 27.7 13.6
25 Iran, Islamic Republic of . . 0.0 28.6 0.0 9.5
26 Venezuela . 20.0 0.0 0.0 0.0 3.6
27 Bangladesh 33.3 20.0 0.0 0.0 0.0 6.9
28 Switzerland 0.0 0.0 0.0 0.0 0.0 0.0
29 USSR 1.3 . . . . 1.3
30 Belgium . 0.0 3.6 5.7 45.7 16.5
31 Turkey . . 0.0 14.9 0.0 7.8
32 Bulgaria 25.0 0.0 0.0 0.0 . 6.1
33 Malaysia . . 17.1 0.0 0.0 6.5
34 Taiwan 0.0 0.0 0.0 0.0 0.0 0.0
35 Algeria 0.0 50.0 0.0 22.2 12.1 12.6
36 Israel 9.1 0.0 0.0 0.0 0.0 3.1
37 New Zealand 0.0 7.9 0.0 . 0.0 4.0
38 Greece . . 55.6 0.0 0.0 14.2
39 Ukraine 0.0 0.0 0.0 0.0 0.0 0.0
40 Finland 16.7 0.0 0.0 0.0 0.0 6.3
41 Chile . 50.0 0.0 0.0 0.0 8.4
42 Cuba . 0.0 0.0 0.0 . 0.0
43 Czechoslovakia 0.0 . . . . 0.0
44 Mexico 0.0 0.0 0.0 0.0 0.0 0.0
45 Morocco 0.0 0.0 0.0 . 0.0 0.0
46 Saudi Arabia . . 0.0 0.0 0.0 0.0
47 Argentina . 0.0 0.0 0.0 . 0.0
48 Pakistan . 0.0 . 0.0 0.0 0.0
49 Thailand . . 0.0 0.0 0.0 0.0
50 Denmark . 0.0 0.0 0.0 . 0.0
51 Norway 66.7 0.0 0.0 . . 41.7
52 Romania 100.0 . 0.0 . 0.0 22.2

Share of publications among 10% most cited in field, fractionalized (%)


Bar chart of publication_year

Field normalized citation rate (cf), fractionalized

Obs Country 1990-1994 1995-1999 2000-2004 2005-2009 2010-2014 All years
1 All countries 1.09 1.06 0.80 0.87 0.80 0.91
2 China 0.95 0.78 0.41 0.55 0.77 0.64
3 India 0.85 1.12 0.82 1.07 0.63 0.85
4 United States 2.24 1.28 1.08 1.03 0.81 1.24
5 Japan 0.74 0.83 1.03 0.86 0.53 0.81
6 Germany 1.51 1.53 0.86 1.07 1.38 1.24
7 France 2.00 1.65 1.13 1.13 1.00 1.36
8 Russian Federation 0.13 0.23 0.33 0.44 0.42 0.33
9 Poland 0.29 0.63 0.41 0.35 0.68 0.46
10 Spain 0.67 0.96 0.65 0.78 0.80 0.78
11 United Kingdom 2.08 1.01 0.98 1.76 1.90 1.48
12 Canada 1.04 1.21 1.20 0.52 1.48 1.09
13 Korea, Republic of 0.40 0.70 0.45 0.77 0.85 0.74
14 Italy 0.74 0.85 1.43 0.97 1.21 1.09
15 Egypt 0.13 0.54 0.68 1.05 0.45 0.62
16 Australia 0.52 0.39 1.11 1.96 1.00 1.03
17 South Africa 1.86 1.27 0.71 1.36 0.47 1.22
18 Sweden 0.80 1.12 0.83 2.54 1.06 1.30
19 Netherlands 0.74 1.66 0.79 0.89 0.83 1.11
20 Hungary 2.41 1.93 0.82 0.32 0.64 1.17
21 Czech Republic 0.35 0.29 0.07 0.46 0.53 0.44
22 Portugal . 3.32 1.03 0.69 0.69 0.79
23 Austria 1.37 1.08 0.33 0.26 0.06 0.50
24 Brazil 1.07 0.85 1.27 1.00 1.58 1.25
25 Iran, Islamic Republic of . . 1.24 1.97 0.60 1.08
26 Venezuela . 1.36 0.38 0.30 0.39 0.53
27 Bangladesh 1.15 2.67 1.50 0.84 0.21 1.24
28 Switzerland 0.60 0.57 0.50 0.82 0.37 0.50
29 USSR 0.36 . . . . 0.36
30 Belgium . 0.20 0.94 1.08 3.94 1.80
31 Turkey . . 0.36 1.25 0.12 0.75
32 Bulgaria 1.20 1.01 0.35 0.30 . 0.77
33 Malaysia . . 1.36 0.70 1.04 1.05
34 Taiwan 0.36 0.05 0.25 0.98 0.69 0.46
35 Algeria 0.75 2.72 0.20 1.57 0.90 1.09
36 Israel 0.78 1.30 1.16 0.72 0.56 0.75
37 New Zealand 0.51 1.01 0.77 . 1.63 0.88
38 Greece . . 2.77 0.53 0.55 1.11
39 Ukraine 0.00 0.33 0.34 0.89 0.91 0.36
40 Finland 1.35 0.32 1.81 0.87 0.29 1.00
41 Chile . 1.52 0.30 0.06 0.20 0.44
42 Cuba . 0.13 0.77 0.18 . 0.51
43 Czechoslovakia 0.54 . . . . 0.54
44 Mexico 0.21 0.93 1.02 0.32 0.00 0.61
45 Morocco 0.84 0.04 0.98 . 0.00 0.49
46 Saudi Arabia . . 0.63 0.67 0.40 0.48
47 Argentina . 0.05 0.40 0.00 . 0.16
48 Pakistan . 0.31 . 0.13 0.47 0.31
49 Thailand . . 0.29 0.46 0.93 0.70
50 Denmark . 0.83 0.98 0.09 . 0.79
51 Norway 2.69 2.14 0.16 . . 2.15
52 Romania 3.26 . 0.37 . 0.62 1.15

Field normalized citation rate (cf), fractionalized


Bar chart of publication_year