Lev1: FLOTATION CIRCUITS//CIRCUIT NETWORK OPTIMIZATION//CONCENTRATION CIRCUITS - Statistics for Organizations

Statistics per Organization

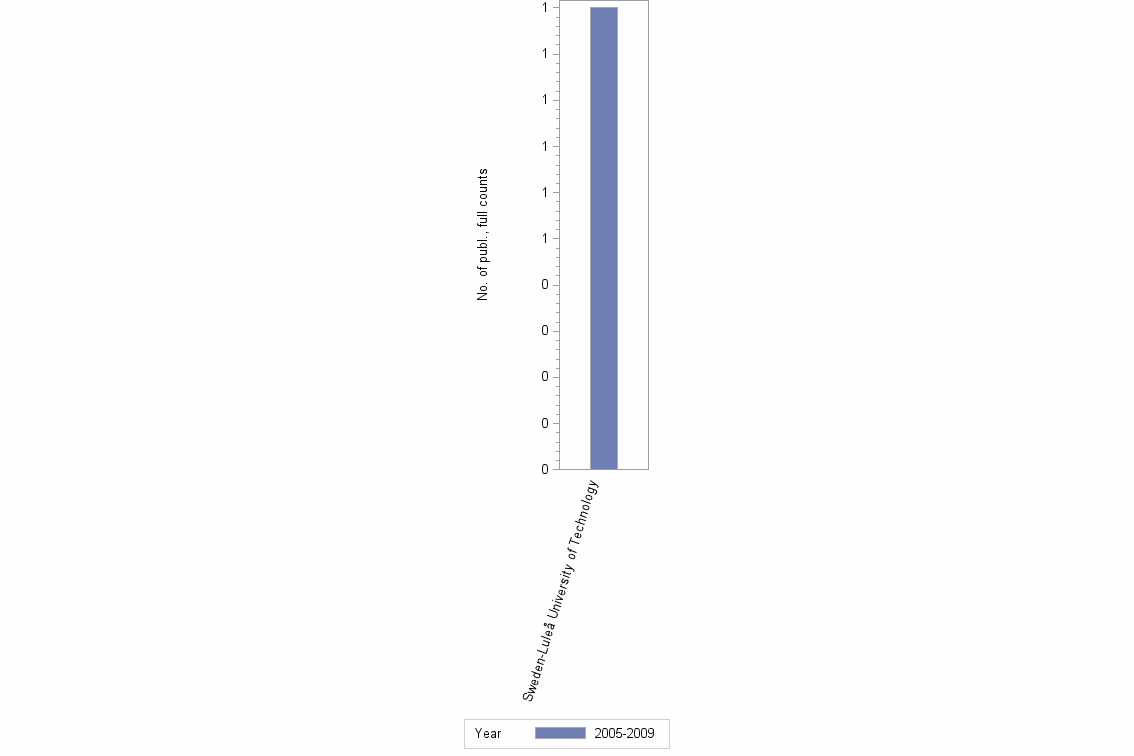
Number of publications, full counts

Obs Organization 1990-1994 1995-1999 2000-2004 2005-2009 2010-2014 All years
1 Sweden-Luleå University of Technology . . . 1 . 1

Number of publications, full counts


Bar chart of publication_year

Share of the total number of publications in the field, full counts (%)

Obs Organization 1990-1994 1995-1999 2000-2004 2005-2009 2010-2014 All years
1 Sweden-Luleå University of Technology . . . 5.3 . 0.8

Share of the total number of publications in the field, full counts (%)


Bar chart of publication_year

Number of publications among 10% most cited in field, full counts

Obs Organization 1990-1994 1995-1999 2000-2004 2005-2009 2010-2014 All years
1 Sweden-Luleå University of Technology . . . 0.0 . 0.0

Number of publications among 10% most cited in field, full counts


Bar chart of publication_year

Share of publications among 10% most cited in field, fractionalized (%)

Obs Organization 1990-1994 1995-1999 2000-2004 2005-2009 2010-2014 All years
1 Sweden-Luleå University of Technology . . . 0.0 . 0.0

Share of publications among 10% most cited in field, fractionalized (%)


Bar chart of publication_year

Field normalized citation rate (cf), fractionalized

Obs Organization 1990-1994 1995-1999 2000-2004 2005-2009 2010-2014 All years
1 Sweden-Luleå University of Technology . . . 0.68 . 0.68

Field normalized citation rate (cf), fractionalized


Bar chart of publication_year