Lev1: NANOBUBBLES//HYDROPHOBIC FORCE//LONG RANGE HYDROPHOBIC FORCE - Statistics for Organizations

Statistics per Organization

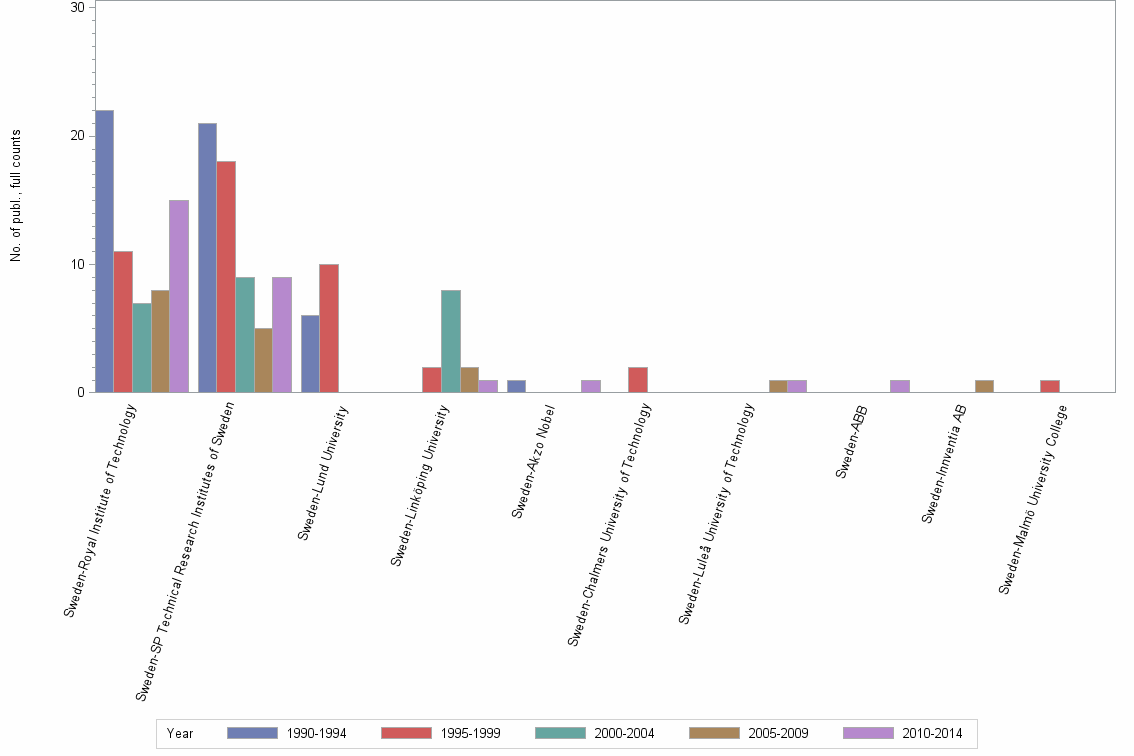
Number of publications, full counts

Obs Organization 1990-1994 1995-1999 2000-2004 2005-2009 2010-2014 All years
1 Sweden-Royal Institute of Technology 22 11 7 8 15 63
2 Sweden-SP Technical Research Institutes of Sweden 21 18 9 5 9 62
3 Sweden-Lund University 6 10 . . . 16
4 Sweden-Linköping University . 2 8 2 1 13
5 Sweden-Akzo Nobel 1 . . . 1 2
6 Sweden-Chalmers University of Technology . 2 . . . 2
7 Sweden-Luleå University of Technology . . . 1 1 2
8 Sweden-ABB . . . . 1 1
9 Sweden-Innventia AB . . . 1 . 1
10 Sweden-Malmö University College . 1 . . . 1

Number of publications, full counts


Bar chart of publication_year

Share of the total number of publications in the field, full counts (%)

Obs Organization 1990-1994 1995-1999 2000-2004 2005-2009 2010-2014 All years
1 Sweden-Royal Institute of Technology 12.5 4.2 2.9 2.7 4.3 4.8
2 Sweden-SP Technical Research Institutes of Sweden 11.9 6.9 3.7 1.7 2.6 4.7
3 Sweden-Lund University 3.4 3.9 . . . 1.2
4 Sweden-Linköping University . 0.8 3.3 0.7 0.3 1.0
5 Sweden-Akzo Nobel 0.6 . . . 0.3 0.2
6 Sweden-Chalmers University of Technology . 0.8 . . . 0.2
7 Sweden-Luleå University of Technology . . . 0.3 0.3 0.2
8 Sweden-ABB . . . . 0.3 0.1
9 Sweden-Innventia AB . . . 0.3 . 0.1
10 Sweden-Malmö University College . 0.4 . . . 0.1

Share of the total number of publications in the field, full counts (%)


Bar chart of publication_year

Number of publications among 10% most cited in field, full counts

Obs Organization 1990-1994 1995-1999 2000-2004 2005-2009 2010-2014 All years
1 Sweden-Royal Institute of Technology 5.7 2.6 0.0 0.0 0.0 8.3
2 Sweden-SP Technical Research Institutes of Sweden 5.7 2.9 0.0 0.0 0.0 8.6
3 Sweden-Lund University 5.0 3.0 . . . 8.0
4 Sweden-Linköping University . 1.0 0.3 0.0 0.0 1.3
5 Sweden-Akzo Nobel 0.0 . . . 0.0 0.0
6 Sweden-Chalmers University of Technology . 1.0 . . . 1.0
7 Sweden-Luleå University of Technology . . . 0.0 0.0 0.0
8 Sweden-ABB . . . . 0.0 0.0
9 Sweden-Innventia AB . . . 0.0 . 0.0
10 Sweden-Malmö University College . 0.0 . . . 0.0

Number of publications among 10% most cited in field, full counts


Bar chart of publication_year

Share of publications among 10% most cited in field, fractionalized (%)

Obs Organization 1990-1994 1995-1999 2000-2004 2005-2009 2010-2014 All years
1 Sweden-Royal Institute of Technology 24.0 30.7 0.0 0.0 0.0 13.3
2 Sweden-SP Technical Research Institutes of Sweden 24.3 22.0 0.0 0.0 0.0 16.0
3 Sweden-Lund University 70.6 22.6 . . . 43.5
4 Sweden-Linköping University . 33.3 3.3 0.0 0.0 5.1
5 Sweden-Akzo Nobel 0.0 . . . 0.0 0.0
6 Sweden-Chalmers University of Technology . 25.0 . . . 25.0
7 Sweden-Luleå University of Technology . . . 0.0 0.0 0.0
8 Sweden-ABB . . . . 0.0 0.0
9 Sweden-Innventia AB . . . 0.0 . 0.0
10 Sweden-Malmö University College . 0.0 . . . 0.0

Share of publications among 10% most cited in field, fractionalized (%)


Bar chart of publication_year

Field normalized citation rate (cf), fractionalized

Obs Organization 1990-1994 1995-1999 2000-2004 2005-2009 2010-2014 All years
1 Sweden-Royal Institute of Technology 1.84 1.71 0.92 0.53 0.36 1.17
2 Sweden-SP Technical Research Institutes of Sweden 1.94 3.44 0.73 0.40 0.60 2.03
3 Sweden-Lund University 5.15 1.74 . . . 3.22
4 Sweden-Linköping University . 1.69 0.58 0.10 1.02 0.65
5 Sweden-Akzo Nobel 0.61 . . . 0.26 0.46
6 Sweden-Chalmers University of Technology . 2.14 . . . 2.14
7 Sweden-Luleå University of Technology . . . 0.13 0.42 0.27
8 Sweden-ABB . . . . 1.07 1.07
9 Sweden-Innventia AB . . . 0.69 . 0.69
10 Sweden-Malmö University College . 0.93 . . . 0.93

Field normalized citation rate (cf), fractionalized


Bar chart of publication_year