Lev3: ELECTROCOAGULATION//HYDRODECHLORINATION//DISINFECTION BY PRODUCTS - Statistics for Organizations |
Statistics per Organization |
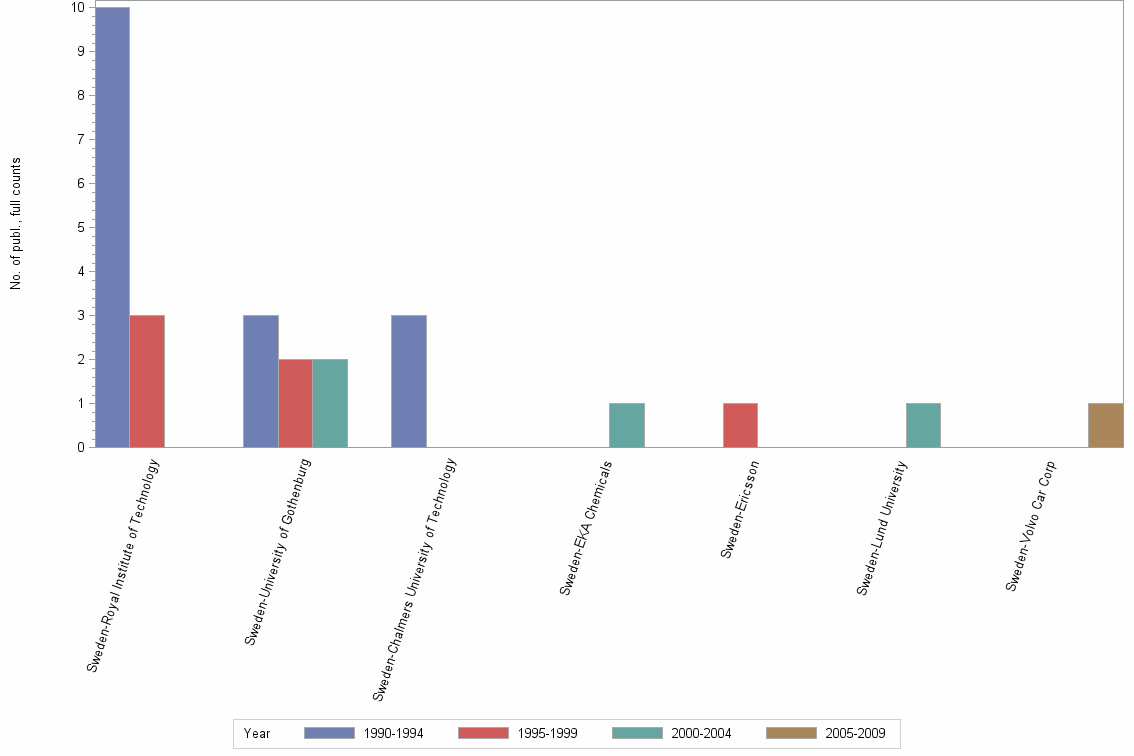
Number of publications, full counts |
| Obs | Organization | 1990-1994 | 1995-1999 | 2000-2004 | 2005-2009 | 2010-2014 | All years |
|---|---|---|---|---|---|---|---|
| 1 | Sweden-Royal Institute of Technology | 10 | 3 | . | . | . | 13 |
| 2 | Sweden-University of Gothenburg | 3 | 2 | 2 | . | . | 7 |
| 3 | Sweden-Chalmers University of Technology | 3 | . | . | . | . | 3 |
| 4 | Sweden-EKA Chemicals | . | . | 1 | . | . | 1 |
| 5 | Sweden-Ericsson | . | 1 | . | . | . | 1 |
| 6 | Sweden-Lund University | . | . | 1 | . | . | 1 |
| 7 | Sweden-Volvo Car Corp | . | . | . | 1 | . | 1 |
Number of publications, full counts |