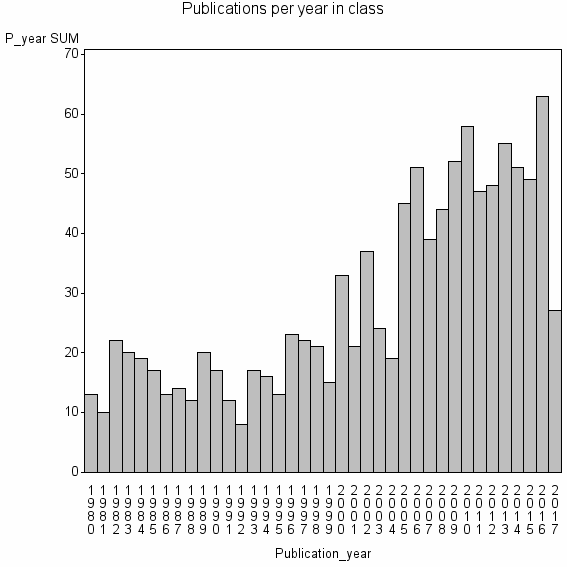
Class information for: |
Basic class information |

Hierarchy of classes |
The table includes all classes above and classes immediately below the current class. |
| Cluster id | Level | Cluster label | #P |
|---|---|---|---|
| 11 | 4 | ECOLOGY//ZOOLOGY//MARINE & FRESHWATER BIOLOGY | 1214215 |
| 103 | 3 | ECOLOGY//BIODIVERSITY CONSERVATION//SPECIES RICHNESS | 75506 |
| 830 | 2 | SEED DISPERSAL//FRUGIVORY//ECOLOGY | 12009 |
| 10505 | 1 | INTEGRAL PROJECTION MODEL//MATRIX POPULATION MODELS//ELASTICITY ANALYSIS | 1087 |
Terms with highest relevance score |
| rank | Category | termType | chi_square | shrOfCwithTerm | shrOfTermInClass | termInClass |
|---|---|---|---|---|---|---|
| 1 | INTEGRAL PROJECTION MODEL | authKW | 1288654 | 6% | 67% | 66 |
| 2 | MATRIX POPULATION MODELS | authKW | 1094903 | 9% | 41% | 93 |
| 3 | ELASTICITY ANALYSIS | authKW | 474346 | 4% | 35% | 47 |
| 4 | STOCHASTIC GROWTH RATE | authKW | 464748 | 2% | 70% | 23 |
| 5 | MATRIX PROJECTION MODELS | authKW | 349982 | 1% | 93% | 13 |
| 6 | POPULATION GROWTH RATE | authKW | 311205 | 6% | 17% | 62 |
| 7 | LIFE CYCLE GRAPH | authKW | 298208 | 1% | 86% | 12 |
| 8 | LTRE ANALYSIS | authKW | 260929 | 1% | 75% | 12 |
| 9 | BIOL MS34 | address | 213489 | 1% | 82% | 9 |
| 10 | STOCHASTIC DEMOGRAPHY | authKW | 213022 | 1% | 57% | 13 |
Web of Science journal categories |
| chi_square_rank | Category | chi_square | shrOfCwithTerm | shrOfTermInClass | termInClass |
|---|---|---|---|---|---|
| 1 | Ecology | 50391 | 76% | 0% | 830 |
| 2 | Evolutionary Biology | 5678 | 15% | 0% | 167 |
| 3 | Biodiversity Conservation | 3239 | 9% | 0% | 94 |
| 4 | Plant Sciences | 2518 | 22% | 0% | 240 |
| 5 | Biology | 672 | 8% | 0% | 83 |
| 6 | Mathematical & Computational Biology | 518 | 4% | 0% | 47 |
| 7 | Forestry | 493 | 4% | 0% | 44 |
| 8 | Genetics & Heredity | 264 | 8% | 0% | 85 |
| 9 | Environmental Sciences | 163 | 8% | 0% | 85 |
| 10 | Demography | 39 | 1% | 0% | 6 |
Address terms |
| chi_square_rank | term | chi_square | shrOfCwithTerm | shrOfTermInClass | termInClass |
|---|---|---|---|---|---|
| 1 | BIOL MS34 | 213489 | 1% | 82% | 9 |
| 2 | MATH ECOL | 183294 | 1% | 45% | 14 |
| 3 | EVOLUTIONARY DEMOG | 129144 | 1% | 64% | 7 |
| 4 | BIOL MS 34 | 113151 | 1% | 35% | 11 |
| 5 | MAX PLANCK ODENSE BIODEMOG AGING | 65309 | 1% | 17% | 13 |
| 6 | EVOLUTIONARY BIODEMOG | 65226 | 1% | 38% | 6 |
| 7 | JARDIN BOT PINAR DEL RIO | 57985 | 0% | 100% | 2 |
| 8 | INT CULTURAL RELATIONSHIPS | 38656 | 0% | 67% | 2 |
| 9 | CHANNEL ISL FIELD STN | 37273 | 0% | 43% | 3 |
| 10 | A AMA COOP FISH WILDLIFE UNIT | 28993 | 0% | 100% | 1 |
Journals |
| chi_square_rank | term | chi_square | shrOfCwithTerm | shrOfTermInClass | termInClass |
|---|---|---|---|---|---|
| 1 | JOURNAL OF ECOLOGY | 85907 | 10% | 3% | 105 |
| 2 | ECOLOGY | 32153 | 10% | 1% | 104 |
| 3 | AMERICAN NATURALIST | 23314 | 6% | 1% | 67 |
| 4 | METHODS IN ECOLOGY AND EVOLUTION | 16341 | 2% | 2% | 23 |
| 5 | POPULATION ECOLOGY | 14203 | 2% | 3% | 19 |
| 6 | THEORETICAL POPULATION BIOLOGY | 13940 | 3% | 2% | 30 |
| 7 | THEORETICAL ECOLOGY | 10942 | 1% | 3% | 11 |
| 8 | ECOLOGY LETTERS | 10553 | 3% | 1% | 29 |
| 9 | OIKOS | 5700 | 3% | 1% | 37 |
| 10 | CONSERVATION BIOLOGY | 4436 | 2% | 1% | 25 |
Author Key Words |
Core articles |
The table includes core articles in the class. The following variables is taken into account for the relevance score of an article in a cluster c: (1) Number of references referring to publications in the class. (2) Share of total number of active references referring to publications in the class. (3) Age of the article. New articles get higher score than old articles. (4) Citation rate, normalized to year. |
Classes with closest relation at Level 1 |