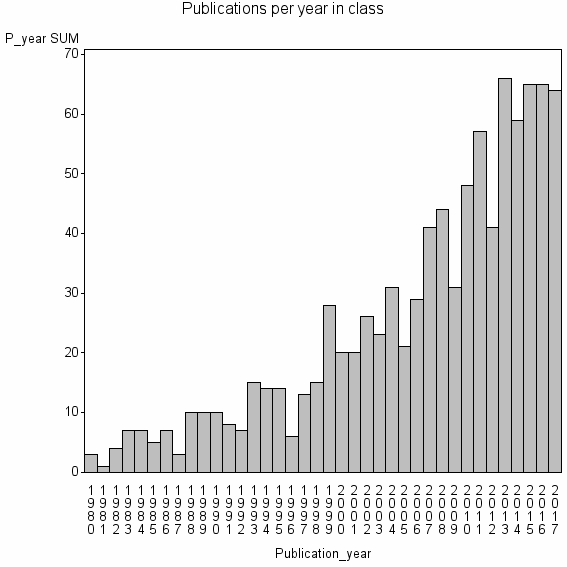
Class information for: |
Basic class information |

Hierarchy of classes |
The table includes all classes above and classes immediately below the current class. |
| Cluster id | Level | Cluster label | #P |
|---|---|---|---|
| 12 | 4 | COMPUTER SCIENCE, THEORY & METHODS//COMPUTER SCIENCE, INFORMATION SYSTEMS//COMPUTER SCIENCE, ARTIFICIAL INTELLIGENCE | 1181119 |
| 23 | 3 | STATISTICS & PROBABILITY//STAT//COMMUNICATIONS IN STATISTICS-THEORY AND METHODS | 119395 |
| 726 | 2 | STATISTICS & PROBABILITY//STATISTICS IN MEDICINE//MULTIPLE IMPUTATION | 13119 |
| 12414 | 1 | COMPETING RISKS//CUMULATIVE INCIDENCE FUNCTION//MULTISTATE MODEL | 938 |
Terms with highest relevance score |
| rank | Category | termType | chi_square | shrOfCwithTerm | shrOfTermInClass | termInClass |
|---|---|---|---|---|---|---|
| 1 | COMPETING RISKS | authKW | 1701926 | 24% | 23% | 221 |
| 2 | CUMULATIVE INCIDENCE FUNCTION | authKW | 1419491 | 7% | 65% | 65 |
| 3 | MULTISTATE MODEL | authKW | 1284102 | 12% | 34% | 114 |
| 4 | CAUSE SPECIFIC HAZARD | authKW | 431793 | 3% | 46% | 28 |
| 5 | SUBDISTRIBUTION HAZARD | authKW | 409574 | 2% | 76% | 16 |
| 6 | CUMULATIVE INCIDENCE | authKW | 364321 | 4% | 26% | 41 |
| 7 | AALEN JOHANSEN ESTIMATOR | authKW | 359975 | 2% | 71% | 15 |
| 8 | ILLNESS DEATH MODEL | authKW | 253268 | 1% | 54% | 14 |
| 9 | FREIBURG DATA ANAL MODELLING | address | 247386 | 2% | 41% | 18 |
| 10 | FINE AND GRAY MODEL | authKW | 179187 | 1% | 67% | 8 |
Web of Science journal categories |
| chi_square_rank | Category | chi_square | shrOfCwithTerm | shrOfTermInClass | termInClass |
|---|---|---|---|---|---|
| 1 | Statistics & Probability | 68044 | 65% | 0% | 612 |
| 2 | Medical Informatics | 38680 | 25% | 0% | 237 |
| 3 | Mathematical & Computational Biology | 37076 | 37% | 0% | 344 |
| 4 | Public, Environmental & Occupational Health | 3670 | 26% | 0% | 247 |
| 5 | Medicine, Research & Experimental | 2514 | 20% | 0% | 189 |
| 6 | Health Care Sciences & Services | 1169 | 8% | 0% | 75 |
| 7 | Biology | 911 | 9% | 0% | 88 |
| 8 | Mathematics, Interdisciplinary Applications | 435 | 5% | 0% | 50 |
| 9 | Social Sciences, Mathematical Methods | 392 | 3% | 0% | 25 |
| 10 | Computer Science, Interdisciplinary Applications | 285 | 5% | 0% | 50 |
Address terms |
| chi_square_rank | term | chi_square | shrOfCwithTerm | shrOfTermInClass | termInClass |
|---|---|---|---|---|---|
| 1 | FREIBURG DATA ANAL MODELLING | 247386 | 2% | 41% | 18 |
| 2 | MED BIOMETRY MED INFORMAT | 70170 | 4% | 6% | 35 |
| 3 | CANC UK NHS STAT MED | 50395 | 0% | 50% | 3 |
| 4 | FREIBURG DATA ANAL MODELING | 47253 | 1% | 13% | 11 |
| 5 | CESIAF | 44797 | 0% | 67% | 2 |
| 6 | 70391 | 33599 | 0% | 100% | 1 |
| 7 | ACUTE LEUKEMIA WORKING PARTY EUROCORD EUROPEAN | 33599 | 0% | 100% | 1 |
| 8 | AMBULATORY CARDIAC ANGIOL REHABIL | 33599 | 0% | 100% | 1 |
| 9 | BIOMETRY RISK ASSESSMENT PROGRAM | 33599 | 0% | 100% | 1 |
| 10 | BIOSTAT MED INFORMAT DIM | 33599 | 0% | 100% | 1 |
Journals |
| chi_square_rank | term | chi_square | shrOfCwithTerm | shrOfTermInClass | termInClass |
|---|---|---|---|---|---|
| 1 | STATISTICS IN MEDICINE | 148404 | 19% | 2% | 180 |
| 2 | LIFETIME DATA ANALYSIS | 81628 | 4% | 7% | 36 |
| 3 | BIOMETRICS | 35950 | 7% | 2% | 70 |
| 4 | STATISTICAL METHODS IN MEDICAL RESEARCH | 23440 | 3% | 3% | 24 |
| 5 | BIOSTATISTICS | 13421 | 2% | 2% | 18 |
| 6 | JOURNAL OF STATISTICAL SOFTWARE | 8013 | 1% | 2% | 14 |
| 7 | BIOMETRICAL JOURNAL | 7317 | 2% | 1% | 23 |
| 8 | STATA JOURNAL | 6908 | 1% | 2% | 10 |
| 9 | SCANDINAVIAN JOURNAL OF STATISTICS | 6752 | 2% | 1% | 17 |
| 10 | BMC MEDICAL RESEARCH METHODOLOGY | 6219 | 2% | 1% | 16 |
Author Key Words |
Core articles |
The table includes core articles in the class. The following variables is taken into account for the relevance score of an article in a cluster c: (1) Number of references referring to publications in the class. (2) Share of total number of active references referring to publications in the class. (3) Age of the article. New articles get higher score than old articles. (4) Citation rate, normalized to year. |
Classes with closest relation at Level 1 |