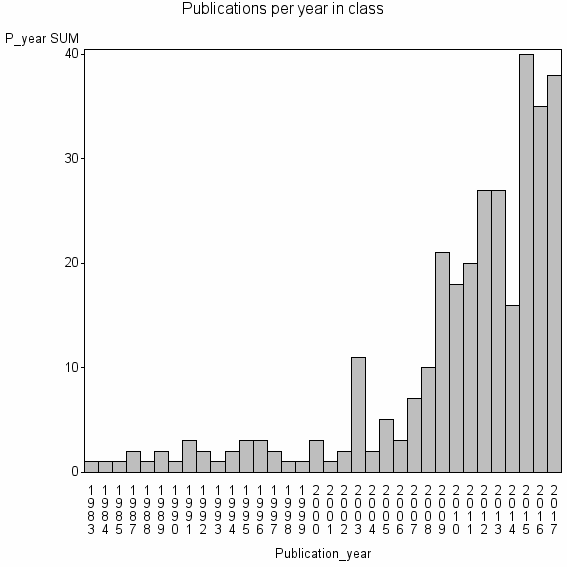
Class information for: |
Basic class information |

Hierarchy of classes |
The table includes all classes above and classes immediately below the current class. |
Terms with highest relevance score |
| rank | Category | termType | chi_square | shrOfCwithTerm | shrOfTermInClass | termInClass |
|---|---|---|---|---|---|---|
| 1 | ASYMMETRIC LAPLACE DISTRIBUTION | authKW | 2042080 | 11% | 60% | 34 |
| 2 | BAYESIAN QUANTILE REGRESSION | authKW | 1134462 | 4% | 87% | 13 |
| 3 | QUANTILE REGRESSION | authKW | 894328 | 36% | 8% | 112 |
| 4 | EXPECTILE REGRESSION | authKW | 495709 | 3% | 62% | 8 |
| 5 | TOBIT QUANTILE REGRESSION | authKW | 419549 | 2% | 83% | 5 |
| 6 | EXPECTILES | authKW | 339164 | 3% | 42% | 8 |
| 7 | ASYMMETRIC LAPLACE DENSITY | authKW | 201384 | 1% | 100% | 2 |
| 8 | B SPLINE PRIOR | authKW | 201384 | 1% | 100% | 2 |
| 9 | BOUNDED OUTCOMES | authKW | 201384 | 1% | 100% | 2 |
| 10 | EMPIRICAL LEVELS | authKW | 201384 | 1% | 100% | 2 |
Web of Science journal categories |
| chi_square_rank | Category | chi_square | shrOfCwithTerm | shrOfTermInClass | termInClass |
|---|---|---|---|---|---|
| 1 | Statistics & Probability | 27608 | 72% | 0% | 225 |
| 2 | Social Sciences, Mathematical Methods | 2665 | 12% | 0% | 36 |
| 3 | Mathematical & Computational Biology | 1236 | 12% | 0% | 37 |
| 4 | Mathematics, Interdisciplinary Applications | 988 | 13% | 0% | 41 |
| 5 | Computer Science, Interdisciplinary Applications | 613 | 12% | 0% | 39 |
| 6 | Economics | 548 | 15% | 0% | 47 |
| 7 | Medical Informatics | 118 | 3% | 0% | 8 |
| 8 | Biology | 89 | 5% | 0% | 17 |
| 9 | Computer Science, Theory & Methods | 51 | 4% | 0% | 13 |
| 10 | Business, Finance | 41 | 2% | 0% | 6 |
Address terms |
| chi_square_rank | term | chi_square | shrOfCwithTerm | shrOfTermInClass | termInClass |
|---|---|---|---|---|---|
| 1 | GATTON BUSINESS ECON 335A | 201384 | 1% | 100% | 2 |
| 2 | BUSINESS ECON 335A | 100692 | 0% | 100% | 1 |
| 3 | BUSINESS QUANTITAT FINANCE | 100692 | 0% | 100% | 1 |
| 4 | CHAIR STAT ECONOMETRY | 100692 | 0% | 100% | 1 |
| 5 | DATA ANALYT RD GRP | 100692 | 0% | 100% | 1 |
| 6 | MED HUMAN CONVERGENT CONTENT | 100692 | 0% | 100% | 1 |
| 7 | TOTH ILONA HLTH SERV | 100692 | 0% | 100% | 1 |
| 8 | ADS METR | 50345 | 0% | 50% | 1 |
| 9 | EXCELLENCE AVIAT OPERAT NEXTOR | 33563 | 0% | 33% | 1 |
| 10 | ADM ECON | 31068 | 2% | 6% | 5 |
Journals |
| chi_square_rank | term | chi_square | shrOfCwithTerm | shrOfTermInClass | termInClass |
|---|---|---|---|---|---|
| 1 | STATISTICS AND COMPUTING | 13242 | 4% | 1% | 12 |
| 2 | BAYESIAN ANALYSIS | 12199 | 2% | 2% | 7 |
| 3 | STATISTICAL MODELLING | 10495 | 2% | 2% | 6 |
| 4 | JOURNAL OF STATISTICAL COMPUTATION AND SIMULATION | 9424 | 5% | 1% | 16 |
| 5 | COMPUTATIONAL STATISTICS & DATA ANALYSIS | 7182 | 6% | 0% | 19 |
| 6 | STATISTICS AND ITS INTERFACE | 5535 | 2% | 1% | 5 |
| 7 | COMPUTATIONAL STATISTICS | 5451 | 2% | 1% | 5 |
| 8 | JOURNAL OF ECONOMETRICS | 5433 | 4% | 0% | 14 |
| 9 | JOURNAL OF THE AMERICAN STATISTICAL ASSOCIATION | 3463 | 4% | 0% | 13 |
| 10 | STATISTICAL METHODS AND APPLICATIONS | 3056 | 1% | 1% | 3 |
Author Key Words |
Core articles |
The table includes core articles in the class. The following variables is taken into account for the relevance score of an article in a cluster c: (1) Number of references referring to publications in the class. (2) Share of total number of active references referring to publications in the class. (3) Age of the article. New articles get higher score than old articles. (4) Citation rate, normalized to year. |
Classes with closest relation at Level 1 |