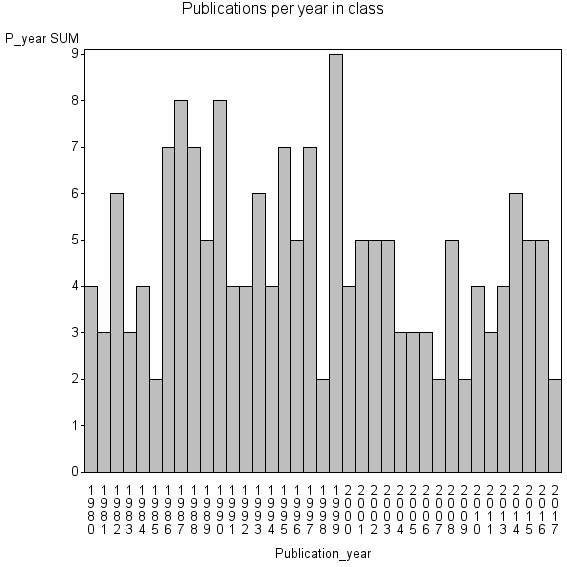
Class information for: |
Basic class information |

Hierarchy of classes |
The table includes all classes above and classes immediately below the current class. |
Terms with highest relevance score |
| rank | Category | termType | chi_square | shrOfCwithTerm | shrOfTermInClass | termInClass |
|---|---|---|---|---|---|---|
| 1 | BLENDED UNDERGROUND STORAGE TANK LEAK MODEL | authKW | 368619 | 1% | 100% | 2 |
| 2 | CONSISTENT CONFIDENCE APPROACH | authKW | 368619 | 1% | 100% | 2 |
| 3 | LINK TRANSFORMATIONS | authKW | 368619 | 1% | 100% | 2 |
| 4 | QUANTAL RESPONSE DATA | authKW | 276461 | 2% | 50% | 3 |
| 5 | ADAPTATIVE NEYMAN TEST | authKW | 184310 | 1% | 100% | 1 |
| 6 | APPROXIMATION DISTRIBUTION | authKW | 184310 | 1% | 100% | 1 |
| 7 | BINARY REGRESSION DATA | authKW | 184310 | 1% | 100% | 1 |
| 8 | BINARY RESPONSE VARIABLES | authKW | 184310 | 1% | 100% | 1 |
| 9 | BIOLO ENVIRONM SCI | address | 184310 | 1% | 100% | 1 |
| 10 | BLENDING COEFFICIENT | authKW | 184310 | 1% | 100% | 1 |
Web of Science journal categories |
| chi_square_rank | Category | chi_square | shrOfCwithTerm | shrOfTermInClass | termInClass |
|---|---|---|---|---|---|
| 1 | Statistics & Probability | 20171 | 83% | 0% | 142 |
| 2 | Mathematical & Computational Biology | 2075 | 20% | 0% | 35 |
| 3 | Medical Informatics | 292 | 5% | 0% | 9 |
| 4 | Computer Science, Interdisciplinary Applications | 158 | 9% | 0% | 15 |
| 5 | Biology | 143 | 9% | 0% | 15 |
| 6 | Mathematics, Interdisciplinary Applications | 97 | 6% | 0% | 10 |
| 7 | Social Sciences, Mathematical Methods | 29 | 2% | 0% | 3 |
| 8 | Economics | 20 | 5% | 0% | 8 |
| 9 | Medicine, Research & Experimental | 6 | 4% | 0% | 6 |
| 10 | Environmental Sciences | 5 | 5% | 0% | 8 |
Address terms |
| chi_square_rank | term | chi_square | shrOfCwithTerm | shrOfTermInClass | termInClass |
|---|---|---|---|---|---|
| 1 | BIOLO ENVIRONM SCI | 184310 | 1% | 100% | 1 |
| 2 | CEPMS CPO PIEMONTE | 184310 | 1% | 100% | 1 |
| 3 | COM MATH SCI | 184310 | 1% | 100% | 1 |
| 4 | FB06 | 184310 | 1% | 100% | 1 |
| 5 | RADIAT ONCOL GRP STAT OFF | 184310 | 1% | 100% | 1 |
| 6 | UMR BIA 518 | 184310 | 1% | 100% | 1 |
| 7 | GRP ETUD RECH ANAL DECIS | 36860 | 1% | 20% | 1 |
| 8 | CEFAGE UE | 24752 | 2% | 4% | 3 |
| 9 | STAT ANAL SECT | 18429 | 1% | 10% | 1 |
| 10 | PROGRAMS MATH SCI | 10840 | 1% | 6% | 1 |
Journals |
| chi_square_rank | term | chi_square | shrOfCwithTerm | shrOfTermInClass | termInClass |
|---|---|---|---|---|---|
| 1 | BIOMETRICAL JOURNAL | 10971 | 7% | 0% | 12 |
| 2 | ADVANCES IN ECONOMETRICS | 8376 | 1% | 5% | 1 |
| 3 | COMMUNICATIONS IN STATISTICS-SIMULATION AND COMPUTATION | 6596 | 6% | 0% | 11 |
| 4 | COMPUTATIONAL STATISTICS & DATA ANALYSIS | 5247 | 7% | 0% | 12 |
| 5 | JOURNAL OF THE AMERICAN STATISTICAL ASSOCIATION | 4551 | 6% | 0% | 11 |
| 6 | JOURNAL OF APPLIED STATISTICS | 3576 | 4% | 0% | 7 |
| 7 | ENVIRONMETRICS | 3565 | 3% | 0% | 5 |
| 8 | BIOMETRIKA | 2761 | 4% | 0% | 7 |
| 9 | BIOMETRICS | 2570 | 5% | 0% | 8 |
| 10 | JOURNAL OF THE ROYAL STATISTICAL SOCIETY SERIES C-APPLIED STATISTICS | 2431 | 2% | 0% | 4 |
Author Key Words |
Core articles |
The table includes core articles in the class. The following variables is taken into account for the relevance score of an article in a cluster c: (1) Number of references referring to publications in the class. (2) Share of total number of active references referring to publications in the class. (3) Age of the article. New articles get higher score than old articles. (4) Citation rate, normalized to year. |
Classes with closest relation at Level 1 |