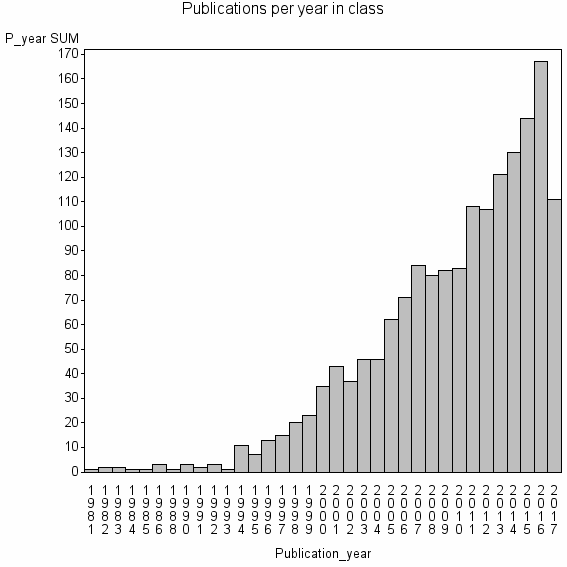
Class information for: |
Basic class information |

Hierarchy of classes |
The table includes all classes above and classes immediately below the current class. |
| Cluster id | Level | Cluster label | #P |
|---|---|---|---|
| 11 | 4 | ECOLOGY//ZOOLOGY//MARINE & FRESHWATER BIOLOGY | 1214215 |
| 103 | 3 | ECOLOGY//BIODIVERSITY CONSERVATION//SPECIES RICHNESS | 75506 |
| 195 | 2 | ECOLOGY//SPECIES DISTRIBUTION MODELS//SPECIES RICHNESS | 20786 |
| 5355 | 1 | ECOSYSTEM FUNCTION//BIODIVERSITY ECOSYSTEM FUNCTIONING//COMPLEMENTARITY EFFECT | 1666 |
Terms with highest relevance score |
| rank | Category | termType | chi_square | shrOfCwithTerm | shrOfTermInClass | termInClass |
|---|---|---|---|---|---|---|
| 1 | ECOSYSTEM FUNCTION | authKW | 825079 | 16% | 17% | 260 |
| 2 | BIODIVERSITY ECOSYSTEM FUNCTIONING | authKW | 418011 | 3% | 39% | 57 |
| 3 | COMPLEMENTARITY EFFECT | authKW | 407890 | 2% | 74% | 29 |
| 4 | JENA EXPERIMENT | authKW | 312691 | 1% | 72% | 23 |
| 5 | OVERYIELDING | authKW | 303452 | 2% | 42% | 38 |
| 6 | SAMPLING EFFECT | authKW | 278334 | 2% | 45% | 33 |
| 7 | SELECTION EFFECT | authKW | 205939 | 2% | 39% | 28 |
| 8 | THE JENA EXPERIMENT | authKW | 204478 | 1% | 54% | 20 |
| 9 | TRANSGRESSIVE OVERYIELDING | authKW | 188041 | 1% | 76% | 13 |
| 10 | PORTFOLIO EFFECT | authKW | 184525 | 1% | 49% | 20 |
Web of Science journal categories |
| chi_square_rank | Category | chi_square | shrOfCwithTerm | shrOfTermInClass | termInClass |
|---|---|---|---|---|---|
| 1 | Ecology | 77095 | 76% | 0% | 1271 |
| 2 | Plant Sciences | 1248 | 13% | 0% | 222 |
| 3 | Evolutionary Biology | 1135 | 6% | 0% | 97 |
| 4 | Biodiversity Conservation | 1037 | 4% | 0% | 68 |
| 5 | Agronomy | 420 | 5% | 0% | 80 |
| 6 | Marine & Freshwater Biology | 417 | 5% | 0% | 89 |
| 7 | Soil Science | 403 | 3% | 0% | 54 |
| 8 | Environmental Sciences | 352 | 9% | 0% | 148 |
| 9 | Biology | 324 | 5% | 0% | 77 |
| 10 | Forestry | 265 | 3% | 0% | 42 |
Address terms |
| chi_square_rank | term | chi_square | shrOfCwithTerm | shrOfTermInClass | termInClass |
|---|---|---|---|---|---|
| 1 | ECOL ENVIRONM MODELLING GRP | 121059 | 0% | 80% | 8 |
| 2 | ECOTRON UPS 3248 | 102984 | 0% | 78% | 7 |
| 3 | BIO ERS THEORY MODELLING | 100394 | 1% | 28% | 19 |
| 4 | JF BLUMENBACH ZOOL ANTHROPOL | 80118 | 2% | 12% | 35 |
| 5 | PHYSIOL ERS | 73819 | 1% | 35% | 11 |
| 6 | THEORET EXPT ECOL STN | 57922 | 0% | 44% | 7 |
| 7 | BIOL SPECIAL BOT FUNCT BIO ERS | 56748 | 0% | 100% | 3 |
| 8 | GEOCOL | 56748 | 0% | 100% | 3 |
| 9 | EVOLUTIONARY BIOL ENVIRONM STUDIES | 56379 | 3% | 5% | 57 |
| 10 | BREN ENVIRONM | 54514 | 0% | 41% | 7 |
Journals |
| chi_square_rank | term | chi_square | shrOfCwithTerm | shrOfTermInClass | termInClass |
|---|---|---|---|---|---|
| 1 | ECOLOGY LETTERS | 71016 | 6% | 4% | 93 |
| 2 | OIKOS | 64109 | 9% | 2% | 153 |
| 3 | ECOLOGY | 47195 | 9% | 2% | 156 |
| 4 | BASIC AND APPLIED ECOLOGY | 21133 | 2% | 3% | 35 |
| 5 | JOURNAL OF ECOLOGY | 13677 | 3% | 1% | 52 |
| 6 | JOURNAL OF PLANT ECOLOGY | 11800 | 1% | 4% | 17 |
| 7 | OECOLOGIA | 8136 | 4% | 1% | 70 |
| 8 | FOURRAGES | 5124 | 1% | 3% | 9 |
| 9 | PERSPECTIVES IN PLANT ECOLOGY EVOLUTION AND SYSTEMATICS | 4958 | 1% | 3% | 10 |
| 10 | AMERICAN NATURALIST | 2616 | 2% | 1% | 28 |
Author Key Words |
Core articles |
The table includes core articles in the class. The following variables is taken into account for the relevance score of an article in a cluster c: (1) Number of references referring to publications in the class. (2) Share of total number of active references referring to publications in the class. (3) Age of the article. New articles get higher score than old articles. (4) Citation rate, normalized to year. |
Classes with closest relation at Level 1 |