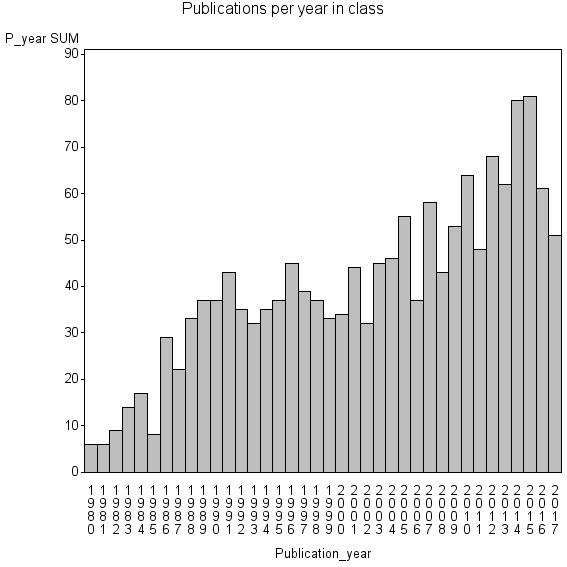
Class information for: |
Basic class information |

Hierarchy of classes |
The table includes all classes above and classes immediately below the current class. |
| Cluster id | Level | Cluster label | #P |
|---|---|---|---|
| 11 | 4 | ECOLOGY//ZOOLOGY//MARINE & FRESHWATER BIOLOGY | 1214215 |
| 103 | 3 | ECOLOGY//BIODIVERSITY CONSERVATION//SPECIES RICHNESS | 75506 |
| 830 | 2 | SEED DISPERSAL//FRUGIVORY//ECOLOGY | 12009 |
| 6403 | 1 | G MATRIX//QUANTITATIVE GENETICS//PHENOTYPIC PLASTICITY | 1516 |
Terms with highest relevance score |
| rank | Category | termType | chi_square | shrOfCwithTerm | shrOfTermInClass | termInClass |
|---|---|---|---|---|---|---|
| 1 | G MATRIX | authKW | 640743 | 4% | 45% | 68 |
| 2 | QUANTITATIVE GENETICS | authKW | 401169 | 9% | 14% | 137 |
| 3 | PHENOTYPIC PLASTICITY | authKW | 340620 | 17% | 6% | 253 |
| 4 | EVOLUTION | journal | 243698 | 20% | 4% | 300 |
| 5 | GENETIC CONSTRAINTS | authKW | 237882 | 2% | 34% | 34 |
| 6 | SELECTION GRADIENT | authKW | 233918 | 3% | 26% | 44 |
| 7 | REACTION NORM | authKW | 176604 | 4% | 13% | 65 |
| 8 | MATRIX COMPARISON | authKW | 175647 | 1% | 65% | 13 |
| 9 | GENETIC VARIANCE COVARIANCE MATRIX | authKW | 167682 | 1% | 73% | 11 |
| 10 | PHENOTYPIC INTEGRATION | authKW | 147089 | 2% | 26% | 27 |
Web of Science journal categories |
| chi_square_rank | Category | chi_square | shrOfCwithTerm | shrOfTermInClass | termInClass |
|---|---|---|---|---|---|
| 1 | Evolutionary Biology | 117852 | 58% | 1% | 880 |
| 2 | Ecology | 53356 | 67% | 0% | 1011 |
| 3 | Genetics & Heredity | 21004 | 49% | 0% | 737 |
| 4 | Plant Sciences | 1367 | 14% | 0% | 219 |
| 5 | Biology | 941 | 8% | 0% | 116 |
| 6 | Mathematical & Computational Biology | 104 | 2% | 0% | 28 |
| 7 | Biodiversity Conservation | 66 | 1% | 0% | 19 |
| 8 | Zoology | 48 | 3% | 0% | 42 |
| 9 | Ornithology | 42 | 1% | 0% | 10 |
| 10 | Horticulture | 16 | 1% | 0% | 12 |
Address terms |
| chi_square_rank | term | chi_square | shrOfCwithTerm | shrOfTermInClass | termInClass |
|---|---|---|---|---|---|
| 1 | EDWARD GREY | 36367 | 2% | 6% | 29 |
| 2 | BIO ERS DYNAM | 25752 | 1% | 7% | 17 |
| 3 | MINNESOTA COMMUNITY GENET | 22168 | 0% | 27% | 4 |
| 4 | EVOLUTIONARY BIOL | 21469 | 5% | 1% | 82 |
| 5 | ARID GRASSLAND ECOL MOL ECOL | 20788 | 0% | 100% | 1 |
| 6 | BIOINFO TEAM UNIV NICE SOPHIA ANTIPOLIS | 20788 | 0% | 100% | 1 |
| 7 | BIOL ECOL ANIM SYSTEMAT | 20788 | 0% | 100% | 1 |
| 8 | BIOL EVOLUTIONARY | 20788 | 0% | 100% | 1 |
| 9 | BIOL O116 | 20788 | 0% | 100% | 1 |
| 10 | CDER OTS OB WHITE OAK DB4 | 20788 | 0% | 100% | 1 |
Journals |
| chi_square_rank | term | chi_square | shrOfCwithTerm | shrOfTermInClass | termInClass |
|---|---|---|---|---|---|
| 1 | EVOLUTION | 243698 | 20% | 4% | 300 |
| 2 | JOURNAL OF EVOLUTIONARY BIOLOGY | 122901 | 10% | 4% | 153 |
| 3 | AMERICAN NATURALIST | 29488 | 6% | 2% | 89 |
| 4 | HEREDITY | 14126 | 4% | 1% | 56 |
| 5 | EVOLUTIONARY ECOLOGY RESEARCH | 8991 | 2% | 2% | 23 |
| 6 | EVOLUTIONARY ECOLOGY | 7575 | 2% | 2% | 24 |
| 7 | TRENDS IN ECOLOGY & EVOLUTION | 6721 | 2% | 1% | 27 |
| 8 | INTERNATIONAL JOURNAL OF PLANT SCIENCES | 5403 | 2% | 1% | 25 |
| 9 | AMERICAN JOURNAL OF BOTANY | 3626 | 2% | 0% | 36 |
| 10 | EVOLUTIONARY BIOLOGY | 3106 | 1% | 2% | 9 |
Author Key Words |
Core articles |
The table includes core articles in the class. The following variables is taken into account for the relevance score of an article in a cluster c: (1) Number of references referring to publications in the class. (2) Share of total number of active references referring to publications in the class. (3) Age of the article. New articles get higher score than old articles. (4) Citation rate, normalized to year. |
Classes with closest relation at Level 1 |