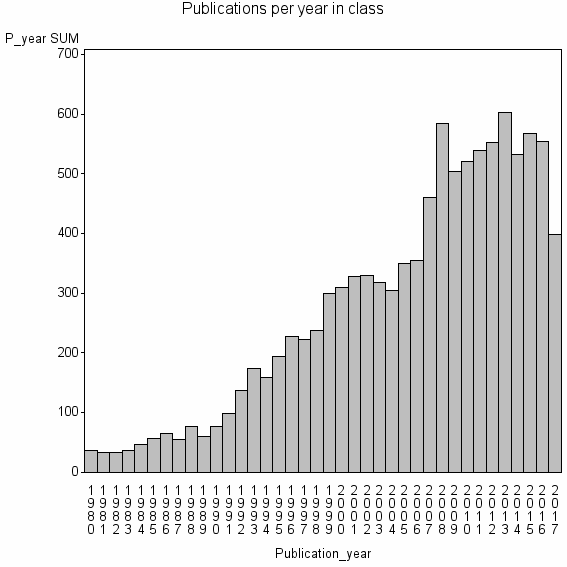
Class information for: |
Basic class information |

Hierarchy of classes |
The table includes all classes above and classes immediately below the current class. |
Terms with highest relevance score |
| rank | Category | termType | chi_square | shrOfCwithTerm | shrOfTermInClass | termInClass |
|---|---|---|---|---|---|---|
| 1 | ECONOMICS | WoSSC | 662998 | 85% | 3% | 8856 |
| 2 | ENDOGENOUS GROWTH | authKW | 588261 | 3% | 54% | 361 |
| 3 | ECONOMIC GROWTH | authKW | 386206 | 7% | 18% | 704 |
| 4 | ECON | address | 303124 | 32% | 3% | 3292 |
| 5 | HUMAN CAPITAL | authKW | 191037 | 4% | 15% | 412 |
| 6 | JOURNAL OF ECONOMIC GROWTH | journal | 176689 | 1% | 49% | 119 |
| 7 | INDETERMINACY | authKW | 129999 | 1% | 32% | 135 |
| 8 | ENDOGENOUS FERTILITY | authKW | 114688 | 0% | 86% | 44 |
| 9 | OVERLAPPING GENERATIONS | authKW | 111380 | 1% | 29% | 126 |
| 10 | TRANSITIONAL DYNAMICS | authKW | 95803 | 0% | 62% | 51 |
Web of Science journal categories |
| chi_square_rank | Category | chi_square | shrOfCwithTerm | shrOfTermInClass | termInClass |
|---|---|---|---|---|---|
| 1 | Economics | 662998 | 85% | 3% | 8856 |
| 2 | Planning & Development | 18484 | 6% | 1% | 608 |
| 3 | Social Sciences, Mathematical Methods | 15115 | 5% | 1% | 504 |
| 4 | Business, Finance | 9587 | 5% | 1% | 492 |
| 5 | Demography | 9028 | 2% | 1% | 256 |
| 6 | Environmental Studies | 4690 | 4% | 0% | 428 |
| 7 | Geography | 4601 | 3% | 1% | 343 |
| 8 | International Relations | 2013 | 2% | 0% | 215 |
| 9 | History of Social Sciences | 1320 | 1% | 1% | 95 |
| 10 | Business | 1303 | 2% | 0% | 250 |
Address terms |
| chi_square_rank | term | chi_square | shrOfCwithTerm | shrOfTermInClass | termInClass |
|---|---|---|---|---|---|
| 1 | ECON | 303124 | 32% | 3% | 3292 |
| 2 | GRONINGEN GROWTH DEV | 33555 | 0% | 56% | 20 |
| 3 | CREPP | 22210 | 0% | 27% | 27 |
| 4 | CONSUMER PRICES PRICE INDEXES | 15108 | 0% | 100% | 5 |
| 5 | OFF PROD TECHNOL | 11780 | 0% | 35% | 11 |
| 6 | GREQAM | 10190 | 0% | 10% | 35 |
| 7 | ECON FINANCE | 9778 | 1% | 3% | 131 |
| 8 | ESCOLA SUPER COMUNICACAO SOCIAL | 9667 | 0% | 80% | 4 |
| 9 | ANAL ECON | 9170 | 0% | 8% | 40 |
| 10 | KIER | 8780 | 0% | 36% | 8 |
Journals |
| chi_square_rank | term | chi_square | shrOfCwithTerm | shrOfTermInClass | termInClass |
|---|---|---|---|---|---|
| 1 | JOURNAL OF ECONOMIC GROWTH | 176689 | 1% | 49% | 119 |
| 2 | MACROECONOMIC DYNAMICS | 94670 | 2% | 19% | 166 |
| 3 | JOURNAL OF MACROECONOMICS | 76367 | 2% | 12% | 211 |
| 4 | JOURNAL OF POPULATION ECONOMICS | 74655 | 1% | 16% | 155 |
| 5 | REVIEW OF INCOME AND WEALTH | 62999 | 1% | 15% | 138 |
| 6 | JOURNAL OF ECONOMIC DYNAMICS & CONTROL | 56048 | 2% | 8% | 238 |
| 7 | REVIEW OF ECONOMIC DYNAMICS | 55470 | 1% | 16% | 112 |
| 8 | ECONOMIC MODELLING | 52834 | 2% | 7% | 248 |
| 9 | ECONOMICS LETTERS | 47528 | 4% | 4% | 395 |
| 10 | JOURNAL OF DEVELOPMENT ECONOMICS | 39458 | 2% | 7% | 182 |
Author Key Words |
Core articles |
The table includes core articles in the class. The following variables is taken into account for the relevance score of an article in a cluster c: (1) Number of references referring to publications in the class. (2) Share of total number of active references referring to publications in the class. (3) Age of the article. New articles get higher score than old articles. (4) Citation rate, normalized to year. |
Classes with closest relation at Level 2 |