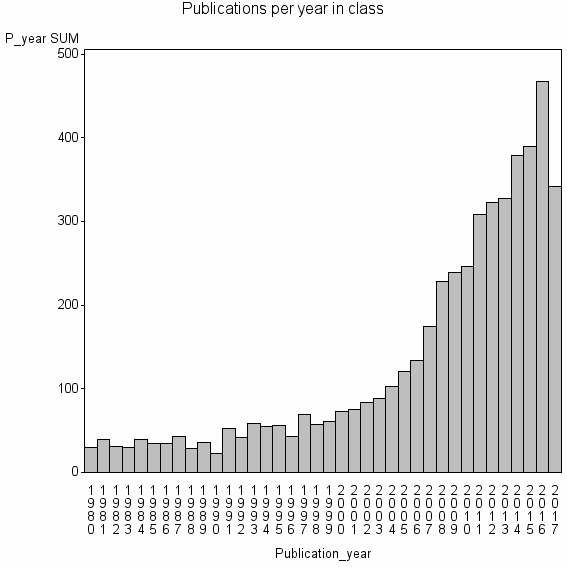
Class information for: |
Basic class information |

Hierarchy of classes |
The table includes all classes above and classes immediately below the current class. |
Terms with highest relevance score |
| rank | Category | termType | chi_square | shrOfCwithTerm | shrOfTermInClass | termInClass |
|---|---|---|---|---|---|---|
| 1 | CAUSAL INFERENCE | authKW | 1831704 | 11% | 51% | 562 |
| 2 | PROPENSITY SCORE | authKW | 814184 | 8% | 33% | 389 |
| 3 | PRINCIPAL STRATIFICATION | authKW | 529430 | 2% | 80% | 104 |
| 4 | POTENTIAL OUTCOMES | authKW | 404942 | 2% | 64% | 99 |
| 5 | MARGINAL STRUCTURAL MODELS | authKW | 313399 | 2% | 51% | 97 |
| 6 | CONFOUNDING | authKW | 291714 | 4% | 25% | 186 |
| 7 | INSTRUMENTAL VARIABLES | authKW | 285711 | 5% | 19% | 231 |
| 8 | DYNAMIC TREATMENT REGIMES | authKW | 269310 | 1% | 92% | 46 |
| 9 | OBSERVATIONAL STUDY | authKW | 244130 | 5% | 14% | 266 |
| 10 | ADAPTIVE TREATMENT STRATEGIES | authKW | 167244 | 1% | 91% | 29 |
Web of Science journal categories |
| chi_square_rank | Category | chi_square | shrOfCwithTerm | shrOfTermInClass | termInClass |
|---|---|---|---|---|---|
| 1 | Statistics & Probability | 95321 | 34% | 1% | 1678 |
| 2 | Mathematical & Computational Biology | 35794 | 16% | 1% | 786 |
| 3 | Medical Informatics | 27032 | 9% | 1% | 460 |
| 4 | Social Sciences, Mathematical Methods | 17933 | 8% | 1% | 374 |
| 5 | Public, Environmental & Occupational Health | 15014 | 23% | 0% | 1157 |
| 6 | Economics | 5983 | 13% | 0% | 627 |
| 7 | Health Care Sciences & Services | 5407 | 8% | 0% | 372 |
| 8 | Psychology, Mathematical | 2288 | 2% | 0% | 80 |
| 9 | Medicine, Research & Experimental | 1887 | 8% | 0% | 417 |
| 10 | Industrial Relations & Labor | 1633 | 2% | 0% | 79 |
Address terms |
| chi_square_rank | term | chi_square | shrOfCwithTerm | shrOfTermInClass | termInClass |
|---|---|---|---|---|---|
| 1 | PHARMACOEPIDEMIOL PHARMACOECON | 37622 | 2% | 8% | 75 |
| 2 | SWISS EMPIR ECON SEW | 36643 | 0% | 48% | 12 |
| 3 | BIOSTAT | 23845 | 12% | 1% | 591 |
| 4 | ENVIRONM MED BEHAV SCI | 21199 | 0% | 33% | 10 |
| 5 | WHARTON | 20954 | 2% | 3% | 113 |
| 6 | CPA CANADA ACCOUNTING GOVERNANCE | 19092 | 0% | 100% | 3 |
| 7 | HLTH MANAGEMENT POLICY EVALUAT | 18877 | 0% | 21% | 14 |
| 8 | SWISS EMPIR ECON | 17616 | 0% | 46% | 6 |
| 9 | SWISS INT ECON PL ECON | 16357 | 0% | 43% | 6 |
| 10 | EPIDEMIOL BIOSTAT OCCUPAT HLTH | 16315 | 1% | 4% | 72 |
Journals |
| chi_square_rank | term | chi_square | shrOfCwithTerm | shrOfTermInClass | termInClass |
|---|---|---|---|---|---|
| 1 | INTERNATIONAL JOURNAL OF BIOSTATISTICS | 141814 | 2% | 29% | 76 |
| 2 | STATISTICS IN MEDICINE | 99880 | 7% | 5% | 340 |
| 3 | EPIDEMIOLOGY | 53315 | 3% | 6% | 147 |
| 4 | BIOMETRICS | 28249 | 3% | 3% | 143 |
| 5 | JOURNAL OF THE AMERICAN STATISTICAL ASSOCIATION | 27913 | 3% | 3% | 147 |
| 6 | STATISTICAL METHODS IN MEDICAL RESEARCH | 24115 | 1% | 7% | 56 |
| 7 | EVALUATION REVIEW | 23630 | 1% | 6% | 65 |
| 8 | PSYCHOLOGICAL METHODS | 20017 | 1% | 7% | 44 |
| 9 | PHARMACOEPIDEMIOLOGY AND DRUG SAFETY | 16809 | 2% | 3% | 80 |
| 10 | STATISTICAL SCIENCE | 16120 | 1% | 6% | 42 |
Author Key Words |
Core articles |
The table includes core articles in the class. The following variables is taken into account for the relevance score of an article in a cluster c: (1) Number of references referring to publications in the class. (2) Share of total number of active references referring to publications in the class. (3) Age of the article. New articles get higher score than old articles. (4) Citation rate, normalized to year. |
Classes with closest relation at Level 2 |