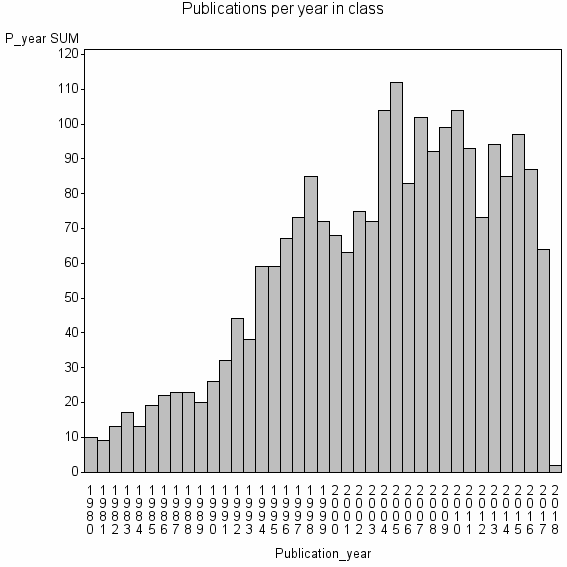
Class information for: |
Basic class information |

Hierarchy of classes |
The table includes all classes above and classes immediately below the current class. |
Terms with highest relevance score |
| rank | Category | termType | chi_square | shrOfCwithTerm | shrOfTermInClass | termInClass |
|---|---|---|---|---|---|---|
| 1 | SLICED INVERSE REGRESSION | authKW | 1702075 | 6% | 89% | 139 |
| 2 | SUFFICIENT DIMENSION REDUCTION | authKW | 1329076 | 5% | 92% | 105 |
| 3 | CENTRAL SUBSPACE | authKW | 981702 | 3% | 93% | 77 |
| 4 | DIMENSION REDUCTION | authKW | 407005 | 8% | 16% | 190 |
| 5 | SLICED AVERAGE VARIANCE ESTIMATION | authKW | 350231 | 1% | 88% | 29 |
| 6 | REGRESSION GRAPHICS | authKW | 344082 | 1% | 96% | 26 |
| 7 | INVERSE REGRESSION | authKW | 337269 | 2% | 52% | 47 |
| 8 | PRINCIPAL CURVES | authKW | 309334 | 2% | 51% | 44 |
| 9 | PRINCIPAL HESSIAN DIRECTIONS | authKW | 274860 | 1% | 100% | 20 |
| 10 | PRINCIPAL POINTS | authKW | 272956 | 1% | 83% | 24 |
Web of Science journal categories |
| chi_square_rank | Category | chi_square | shrOfCwithTerm | shrOfTermInClass | termInClass |
|---|---|---|---|---|---|
| 1 | Statistics & Probability | 54885 | 38% | 0% | 865 |
| 2 | Computer Science, Artificial Intelligence | 13989 | 21% | 0% | 478 |
| 3 | Engineering, Electrical & Electronic | 2552 | 21% | 0% | 492 |
| 4 | Mathematical & Computational Biology | 1561 | 5% | 0% | 117 |
| 5 | Computer Science, Theory & Methods | 1116 | 7% | 0% | 153 |
| 6 | Computer Science, Interdisciplinary Applications | 859 | 6% | 0% | 134 |
| 7 | Computer Science, Information Systems | 669 | 5% | 0% | 116 |
| 8 | Mathematics, Applied | 327 | 6% | 0% | 139 |
| 9 | Biology | 292 | 4% | 0% | 89 |
| 10 | Automation & Control Systems | 258 | 3% | 0% | 60 |
Address terms |
| chi_square_rank | term | chi_square | shrOfCwithTerm | shrOfTermInClass | termInClass |
|---|---|---|---|---|---|
| 1 | PL COMPUTAT INTELLIGENCE UNIT | 67201 | 1% | 33% | 15 |
| 2 | CQFD TEAM | 41223 | 0% | 50% | 6 |
| 3 | SOFTWARE PROGRAMS | 27486 | 0% | 100% | 2 |
| 4 | STAT BIG DATA | 22898 | 0% | 33% | 5 |
| 5 | SICHUAN UNIV LIB | 20611 | 0% | 50% | 3 |
| 6 | DIPARTIMENTO ECON SOC POLIT | 19985 | 0% | 36% | 4 |
| 7 | STAT | 18506 | 13% | 0% | 308 |
| 8 | FINANCE STAT | 14128 | 1% | 4% | 23 |
| 9 | AG NEURO BIOINFORMAT GRP | 13743 | 0% | 100% | 1 |
| 10 | ARC EXCELLENCE MATH STAT FRONTIERSS | 13743 | 0% | 100% | 1 |
Journals |
| chi_square_rank | term | chi_square | shrOfCwithTerm | shrOfTermInClass | termInClass |
|---|---|---|---|---|---|
| 1 | INFORMATICA | 25921 | 1% | 6% | 33 |
| 2 | JOURNAL OF MULTIVARIATE ANALYSIS | 24041 | 3% | 2% | 80 |
| 3 | IEEE TRANSACTIONS ON NEURAL NETWORKS | 19407 | 3% | 2% | 64 |
| 4 | JOURNAL OF THE AMERICAN STATISTICAL ASSOCIATION | 15286 | 3% | 2% | 74 |
| 5 | BIOMETRIKA | 15082 | 3% | 2% | 60 |
| 6 | ANNALS OF STATISTICS | 14472 | 3% | 2% | 65 |
| 7 | STATISTICA SINICA | 13115 | 2% | 2% | 42 |
| 8 | COMPUTATIONAL STATISTICS & DATA ANALYSIS | 11404 | 3% | 1% | 65 |
| 9 | NEURAL NETWORKS | 10559 | 2% | 2% | 50 |
| 10 | NEURAL PROCESSING LETTERS | 8908 | 1% | 3% | 26 |
Author Key Words |
Core articles |
The table includes core articles in the class. The following variables is taken into account for the relevance score of an article in a cluster c: (1) Number of references referring to publications in the class. (2) Share of total number of active references referring to publications in the class. (3) Age of the article. New articles get higher score than old articles. (4) Citation rate, normalized to year. |
Classes with closest relation at Level 2 |