Lev1: TS BLOCK//EUDIALYTE//AGPAITIC - Statistics for Countries |
Statistics per Country |
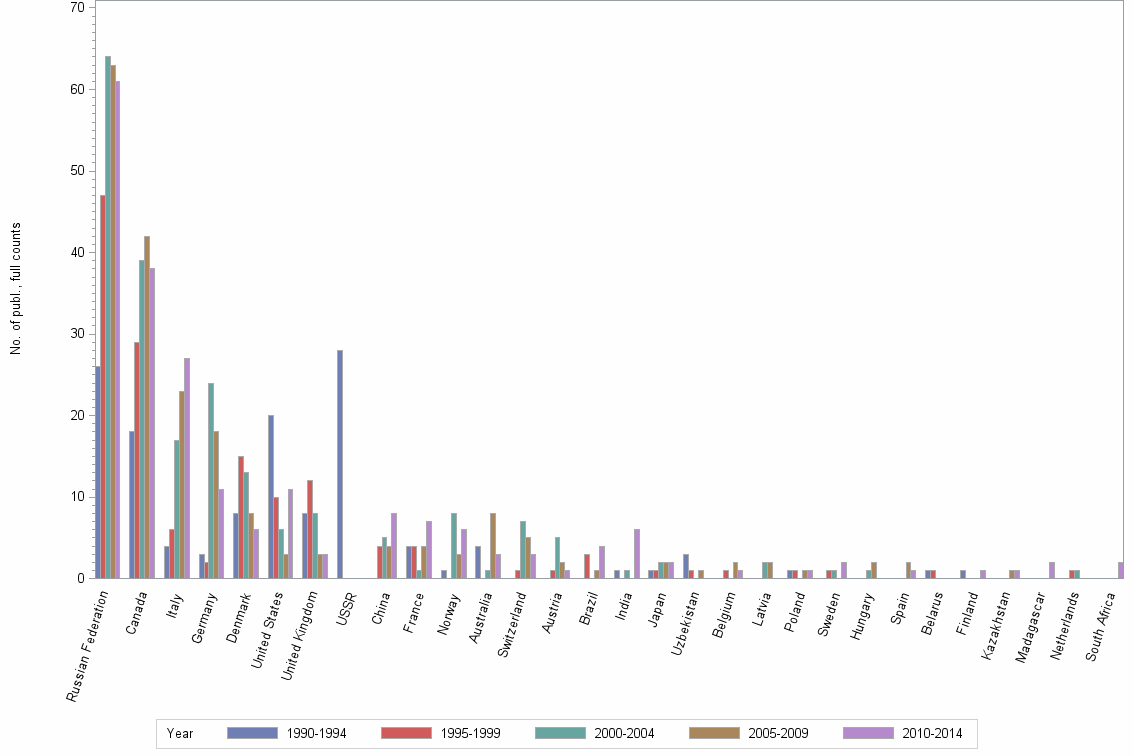
Number of publications, full counts |
| Obs | Country | 1990-1994 | 1995-1999 | 2000-2004 | 2005-2009 | 2010-2014 | All years |
|---|---|---|---|---|---|---|---|
| 1 | All countries | 110 | 107 | 135 | 128 | 134 | 614 |
| 2 | Russian Federation | 26 | 47 | 64 | 63 | 61 | 261 |
| 3 | Canada | 18 | 29 | 39 | 42 | 38 | 166 |
| 4 | Italy | 4 | 6 | 17 | 23 | 27 | 77 |
| 5 | Germany | 3 | 2 | 24 | 18 | 11 | 58 |
| 6 | Denmark | 8 | 15 | 13 | 8 | 6 | 50 |
| 7 | United States | 20 | 10 | 6 | 3 | 11 | 50 |
| 8 | United Kingdom | 8 | 12 | 8 | 3 | 3 | 34 |
| 9 | USSR | 28 | . | . | . | . | 28 |
| 10 | China | . | 4 | 5 | 4 | 8 | 21 |
| 11 | France | 4 | 4 | 1 | 4 | 7 | 20 |
| 12 | Norway | 1 | . | 8 | 3 | 6 | 18 |
| 13 | Australia | 4 | . | 1 | 8 | 3 | 16 |
| 14 | Switzerland | . | 1 | 7 | 5 | 3 | 16 |
| 15 | Austria | . | 1 | 5 | 2 | 1 | 9 |
| 16 | Brazil | . | 3 | . | 1 | 4 | 8 |
| 17 | India | 1 | . | 1 | . | 6 | 8 |
| 18 | Japan | 1 | 1 | 2 | 2 | 2 | 8 |
| 19 | Uzbekistan | 3 | 1 | . | 1 | . | 5 |
| 20 | Belgium | . | 1 | . | 2 | 1 | 4 |
| 21 | Latvia | . | . | 2 | 2 | . | 4 |
| 22 | Poland | 1 | 1 | . | 1 | 1 | 4 |
| 23 | Sweden | . | 1 | 1 | . | 2 | 4 |
| 24 | Hungary | . | . | 1 | 2 | . | 3 |
| 25 | Spain | . | . | . | 2 | 1 | 3 |
| 26 | Belarus | 1 | 1 | . | . | . | 2 |
| 27 | Finland | 1 | . | . | . | 1 | 2 |
| 28 | Kazakhstan | . | . | . | 1 | 1 | 2 |
| 29 | Madagascar | . | . | . | . | 2 | 2 |
| 30 | Netherlands | . | 1 | 1 | . | . | 2 |
| 31 | South Africa | . | . | . | . | 2 | 2 |
| 32 | Argentina | . | . | . | 1 | . | 1 |
| 33 | Bulgaria | . | . | . | 1 | . | 1 |
| 34 | Czech Republic | . | . | . | . | 1 | 1 |
| 35 | Czechoslovakia | 1 | . | . | . | . | 1 |
| 36 | Libya | 1 | . | . | . | . | 1 |
| 37 | Morocco | . | . | . | 1 | . | 1 |
| 38 | Réunion | . | 1 | . | . | . | 1 |
Number of publications, full counts |