Lev1: LOWER MANTLE//POST PEROVSKITE//SILICATE PEROVSKITE - Statistics for Countries |
Statistics per Country |
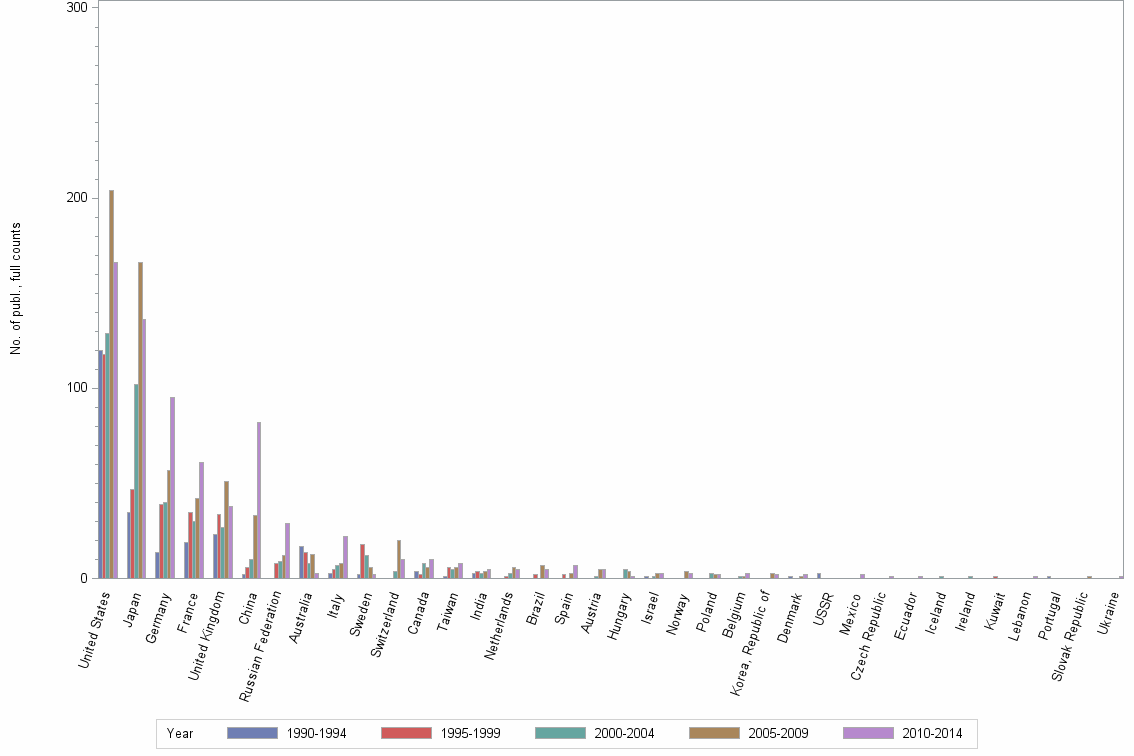
Number of publications, full counts |
| Obs | Country | 1990-1994 | 1995-1999 | 2000-2004 | 2005-2009 | 2010-2014 | All years |
|---|---|---|---|---|---|---|---|
| 1 | All countries | 207 | 281 | 301 | 472 | 442 | 1703 |
| 2 | United States | 120 | 118 | 129 | 204 | 166 | 737 |
| 3 | Japan | 35 | 47 | 102 | 166 | 136 | 486 |
| 4 | Germany | 14 | 39 | 40 | 57 | 95 | 245 |
| 5 | France | 19 | 35 | 30 | 42 | 61 | 187 |
| 6 | United Kingdom | 23 | 34 | 27 | 51 | 38 | 173 |
| 7 | China | 2 | 6 | 10 | 33 | 82 | 133 |
| 8 | Russian Federation | . | 8 | 9 | 12 | 29 | 58 |
| 9 | Australia | 17 | 14 | 8 | 13 | 3 | 55 |
| 10 | Italy | 3 | 5 | 7 | 8 | 22 | 45 |
| 11 | Sweden | 2 | 18 | 12 | 6 | 2 | 40 |
| 12 | Switzerland | . | . | 4 | 20 | 10 | 34 |
| 13 | Canada | 4 | 2 | 8 | 6 | 10 | 30 |
| 14 | Taiwan | 1 | 6 | 5 | 6 | 8 | 26 |
| 15 | India | 3 | 4 | 3 | 4 | 5 | 19 |
| 16 | Netherlands | . | 1 | 3 | 6 | 5 | 15 |
| 17 | Brazil | . | 2 | . | 7 | 5 | 14 |
| 18 | Spain | . | 2 | . | 3 | 7 | 12 |
| 19 | Austria | . | . | 1 | 5 | 5 | 11 |
| 20 | Hungary | . | . | 5 | 4 | 1 | 10 |
| 21 | Israel | 1 | . | 1 | 3 | 3 | 8 |
| 22 | Norway | . | . | . | 4 | 3 | 7 |
| 23 | Poland | . | . | 3 | 2 | 2 | 7 |
| 24 | Belgium | . | . | 1 | 1 | 3 | 5 |
| 25 | Korea, Republic of | . | . | . | 3 | 2 | 5 |
| 26 | Denmark | 1 | . | . | 1 | 2 | 4 |
| 27 | USSR | 3 | . | . | . | . | 3 |
| 28 | Mexico | . | . | . | . | 2 | 2 |
| 29 | Czech Republic | . | . | . | . | 1 | 1 |
| 30 | Ecuador | . | . | . | . | 1 | 1 |
| 31 | Iceland | . | . | 1 | . | . | 1 |
| 32 | Ireland | . | . | 1 | . | . | 1 |
| 33 | Kuwait | . | 1 | . | . | . | 1 |
| 34 | Lebanon | . | . | . | . | 1 | 1 |
| 35 | Portugal | 1 | . | . | . | . | 1 |
| 36 | Slovak Republic | . | . | . | 1 | . | 1 |
| 37 | Ukraine | . | . | . | . | 1 | 1 |
Number of publications, full counts |