Lev1: NATROLITE//PAULINGITE//BREWSTERITE - Statistics for Countries |
Statistics per Country |
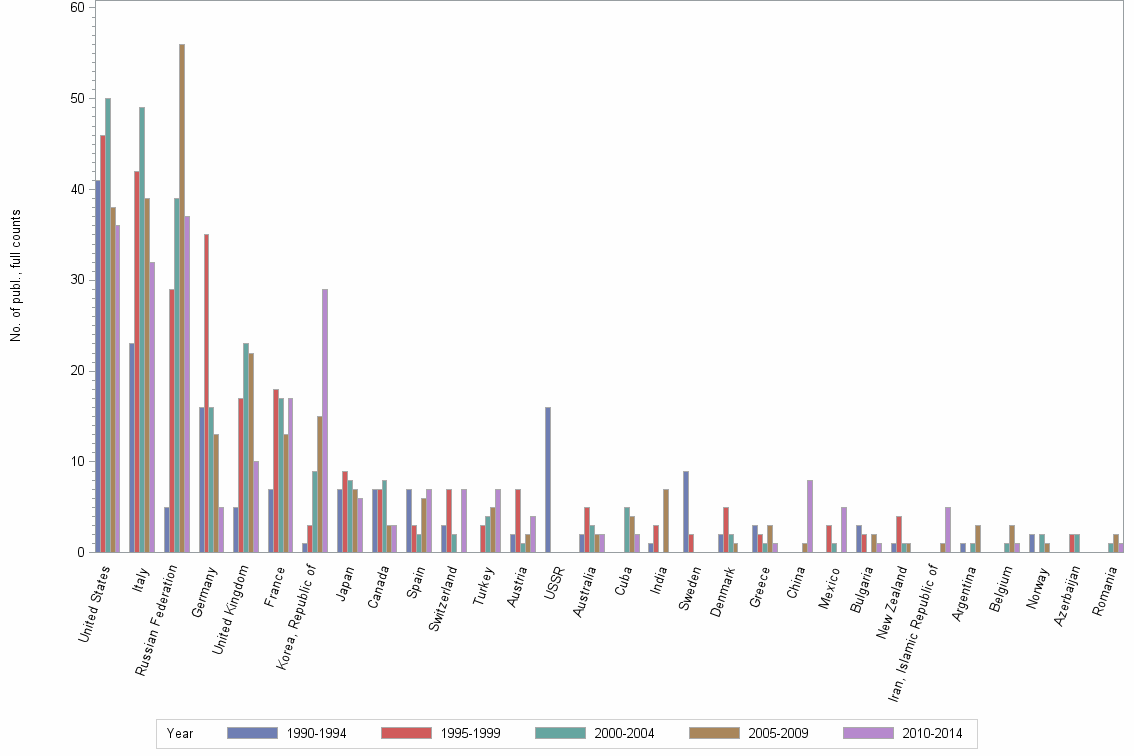
Number of publications, full counts |
| Obs | Country | 1990-1994 | 1995-1999 | 2000-2004 | 2005-2009 | 2010-2014 | All years |
|---|---|---|---|---|---|---|---|
| 1 | All countries | 147 | 193 | 189 | 188 | 162 | 879 |
| 2 | United States | 41 | 46 | 50 | 38 | 36 | 211 |
| 3 | Italy | 23 | 42 | 49 | 39 | 32 | 185 |
| 4 | Russian Federation | 5 | 29 | 39 | 56 | 37 | 166 |
| 5 | Germany | 16 | 35 | 16 | 13 | 5 | 85 |
| 6 | United Kingdom | 5 | 17 | 23 | 22 | 10 | 77 |
| 7 | France | 7 | 18 | 17 | 13 | 17 | 72 |
| 8 | Korea, Republic of | 1 | 3 | 9 | 15 | 29 | 57 |
| 9 | Japan | 7 | 9 | 8 | 7 | 6 | 37 |
| 10 | Canada | 7 | 7 | 8 | 3 | 3 | 28 |
| 11 | Spain | 7 | 3 | 2 | 6 | 7 | 25 |
| 12 | Switzerland | 3 | 7 | 2 | . | 7 | 19 |
| 13 | Turkey | . | 3 | 4 | 5 | 7 | 19 |
| 14 | Austria | 2 | 7 | 1 | 2 | 4 | 16 |
| 15 | USSR | 16 | . | . | . | . | 16 |
| 16 | Australia | 2 | 5 | 3 | 2 | 2 | 14 |
| 17 | Cuba | . | . | 5 | 4 | 2 | 11 |
| 18 | India | 1 | 3 | . | 7 | . | 11 |
| 19 | Sweden | 9 | 2 | . | . | . | 11 |
| 20 | Denmark | 2 | 5 | 2 | 1 | . | 10 |
| 21 | Greece | 3 | 2 | 1 | 3 | 1 | 10 |
| 22 | China | . | . | . | 1 | 8 | 9 |
| 23 | Mexico | . | 3 | 1 | . | 5 | 9 |
| 24 | Bulgaria | 3 | 2 | . | 2 | 1 | 8 |
| 25 | New Zealand | 1 | 4 | 1 | 1 | . | 7 |
| 26 | Iran, Islamic Republic of | . | . | . | 1 | 5 | 6 |
| 27 | Argentina | 1 | . | 1 | 3 | . | 5 |
| 28 | Belgium | . | . | 1 | 3 | 1 | 5 |
| 29 | Norway | 2 | . | 2 | 1 | . | 5 |
| 30 | Azerbaijan | . | 2 | 2 | . | . | 4 |
| 31 | Romania | . | . | 1 | 2 | 1 | 4 |
| 32 | Czechoslovakia | 3 | . | . | . | . | 3 |
| 33 | Hungary | . | . | . | 1 | 2 | 3 |
| 34 | Kazakhstan | 1 | 1 | . | 1 | . | 3 |
| 35 | Slovak Republic | . | . | 2 | . | 1 | 3 |
| 36 | Algeria | 1 | . | . | . | 1 | 2 |
| 37 | Brazil | . | . | 1 | . | 1 | 2 |
| 38 | Czech Republic | . | 1 | . | . | 1 | 2 |
| 39 | Jordan | . | . | 1 | 1 | . | 2 |
| 40 | Singapore | . | . | . | . | 2 | 2 |
| 41 | Slovenia | 1 | . | . | . | 1 | 2 |
| 42 | Belarus | . | 1 | . | . | . | 1 |
| 43 | Chile | . | . | . | 1 | . | 1 |
| 44 | Ecuador | . | . | . | . | 1 | 1 |
| 45 | Ethiopia | . | . | . | 1 | . | 1 |
| 46 | Finland | . | . | . | . | 1 | 1 |
| 47 | Iceland | . | . | 1 | . | . | 1 |
| 48 | Portugal | . | 1 | . | . | . | 1 |
| 49 | Taiwan | . | . | 1 | . | . | 1 |
| 50 | Ukraine | . | 1 | . | . | . | 1 |
Number of publications, full counts |