Lev2: MINERALS ENGINEERING//INTERNATIONAL JOURNAL OF MINERAL PROCESSING//FROTH FLOTATION - Statistics for Countries |
Statistics per Country |
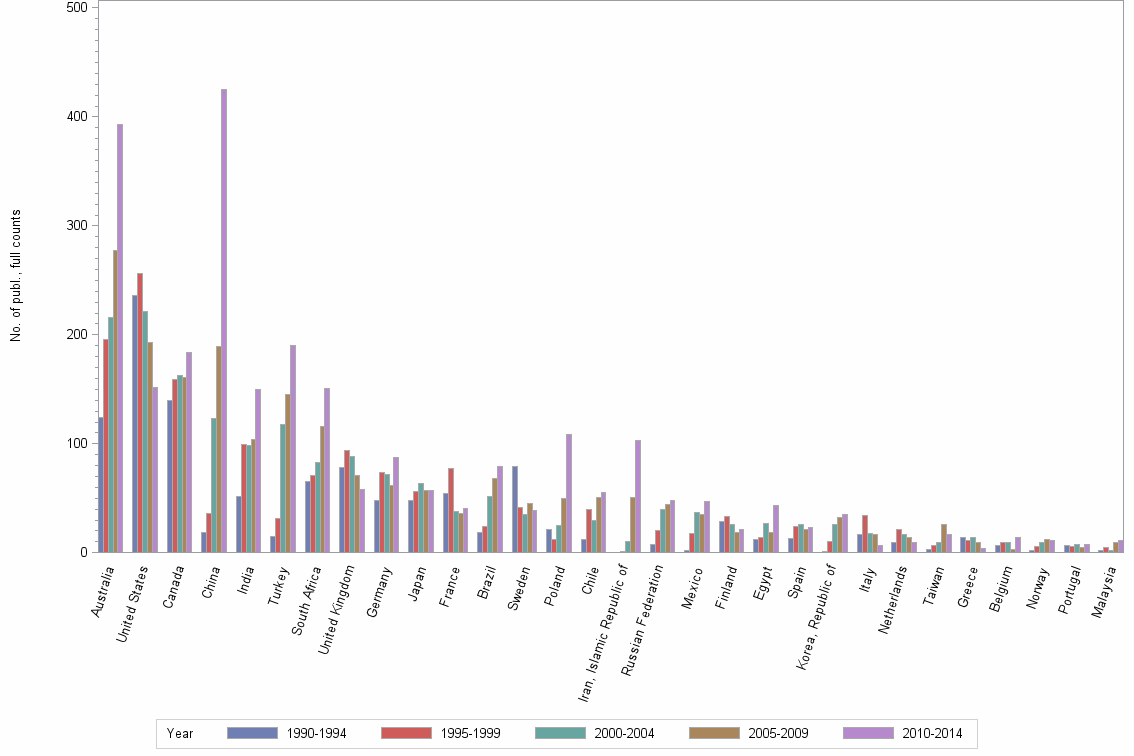
Number of publications, full counts |
| Obs | Country | 1990-1994 | 1995-1999 | 2000-2004 | 2005-2009 | 2010-2014 | All years |
|---|---|---|---|---|---|---|---|
| 1 | All countries | 1103 | 1385 | 1547 | 1777 | 2334 | 8146 |
| 2 | Australia | 124 | 196 | 216 | 277 | 393 | 1206 |
| 3 | United States | 236 | 256 | 221 | 193 | 152 | 1058 |
| 4 | Canada | 140 | 159 | 163 | 161 | 184 | 807 |
| 5 | China | 19 | 36 | 123 | 189 | 425 | 792 |
| 6 | India | 52 | 99 | 98 | 104 | 150 | 503 |
| 7 | Turkey | 15 | 31 | 118 | 145 | 190 | 499 |
| 8 | South Africa | 65 | 71 | 83 | 116 | 151 | 486 |
| 9 | United Kingdom | 78 | 94 | 88 | 71 | 58 | 389 |
| 10 | Germany | 48 | 74 | 72 | 62 | 87 | 343 |
| 11 | Japan | 48 | 56 | 64 | 57 | 57 | 282 |
| 12 | France | 54 | 77 | 38 | 36 | 41 | 246 |
| 13 | Brazil | 19 | 24 | 52 | 68 | 79 | 242 |
| 14 | Sweden | 79 | 42 | 35 | 45 | 39 | 240 |
| 15 | Poland | 21 | 12 | 25 | 50 | 109 | 217 |
| 16 | Chile | 12 | 40 | 30 | 51 | 55 | 188 |
| 17 | Iran, Islamic Republic of | . | 1 | 10 | 51 | 103 | 165 |
| 18 | Russian Federation | 8 | 20 | 40 | 44 | 48 | 160 |
| 19 | Mexico | 2 | 18 | 37 | 35 | 47 | 139 |
| 20 | Finland | 29 | 33 | 26 | 19 | 21 | 128 |
| 21 | Egypt | 12 | 14 | 27 | 19 | 43 | 115 |
| 22 | Spain | 13 | 24 | 26 | 21 | 23 | 107 |
| 23 | Korea, Republic of | 1 | 10 | 26 | 32 | 35 | 104 |
| 24 | Italy | 17 | 34 | 18 | 17 | 7 | 93 |
| 25 | Netherlands | 9 | 21 | 17 | 14 | 9 | 70 |
| 26 | Taiwan | 3 | 7 | 9 | 26 | 17 | 62 |
| 27 | Greece | 14 | 11 | 14 | 9 | 4 | 52 |
| 28 | Belgium | 7 | 9 | 9 | 3 | 14 | 42 |
| 29 | Norway | 2 | 6 | 9 | 12 | 11 | 40 |
| 30 | Portugal | 7 | 6 | 8 | 5 | 8 | 34 |
| 31 | Malaysia | 2 | 5 | 2 | 9 | 11 | 29 |
| 32 | Republic of Serbia | . | . | . | 5 | 20 | 25 |
| 33 | Israel | 6 | 6 | 4 | 6 | 2 | 24 |
| 34 | Bulgaria | 12 | 4 | 3 | 1 | 3 | 23 |
| 35 | Romania | 2 | 2 | 1 | 7 | 10 | 22 |
| 36 | Hungary | 2 | 4 | 4 | 4 | 7 | 21 |
| 37 | Singapore | . | 1 | 10 | 5 | 5 | 21 |
| 38 | Thailand | . | . | 7 | 12 | 2 | 21 |
| 39 | Colombia | . | . | . | 10 | 10 | 20 |
| 40 | Jordan | 3 | 1 | 1 | 7 | 8 | 20 |
| 41 | Saudi Arabia | 3 | 1 | . | . | 15 | 19 |
| 42 | Argentina | 1 | 5 | 2 | 3 | 7 | 18 |
| 43 | Nigeria | 3 | 8 | 2 | 2 | 3 | 18 |
| 44 | Switzerland | 3 | 2 | 2 | 6 | 4 | 17 |
| 45 | Pakistan | 1 | 1 | 3 | 8 | 3 | 16 |
| 46 | Algeria | . | . | 3 | 6 | 6 | 15 |
| 47 | Austria | . | 3 | 6 | 2 | 4 | 15 |
| 48 | New Zealand | 8 | 4 | 1 | . | 2 | 15 |
| 49 | Slovak Republic | 1 | 2 | 1 | 1 | 7 | 12 |
| 50 | USSR | 11 | . | . | . | . | 11 |
| 51 | Czech Republic | . | 2 | . | 4 | 4 | 10 |
| 52 | Ukraine | 2 | 1 | 3 | 1 | 3 | 10 |
| 53 | Yugoslavia | 6 | 1 | 3 | . | . | 10 |
Number of publications, full counts |