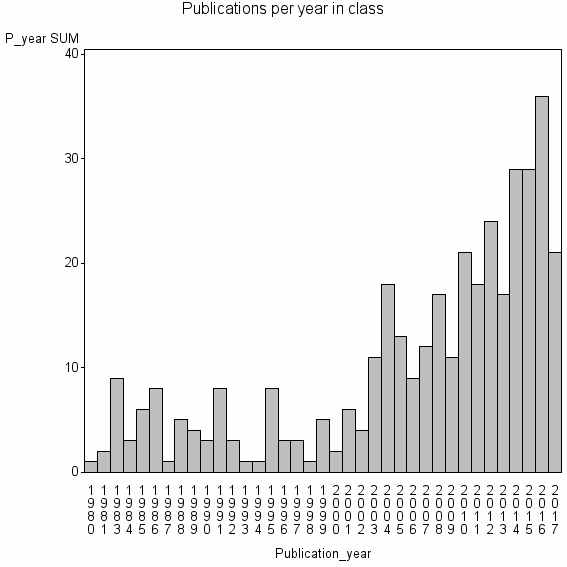
Class information for: |
Basic class information |

Hierarchy of classes |
The table includes all classes above and classes immediately below the current class. |
Terms with highest relevance score |
| rank | Category | termType | chi_square | shrOfCwithTerm | shrOfTermInClass | termInClass |
|---|---|---|---|---|---|---|
| 1 | MODEL AVERAGING | authKW | 583441 | 13% | 14% | 50 |
| 2 | FOCUSED INFORMATION CRITERION | authKW | 427747 | 2% | 56% | 9 |
| 3 | FREQUENTIST MODEL AVERAGING | authKW | 337975 | 2% | 67% | 6 |
| 4 | ADAPTIVE REGRESSION BY MIXING | authKW | 253484 | 1% | 100% | 3 |
| 5 | MODEL WEIGHT | authKW | 253484 | 1% | 100% | 3 |
| 6 | MODEL SELECTION DIAGNOSTICS | authKW | 190112 | 1% | 75% | 3 |
| 7 | BIAS AND VARIANCE BALANCE | authKW | 168989 | 1% | 100% | 2 |
| 8 | MODERATE MISSPECIFICATION | authKW | 168989 | 1% | 100% | 2 |
| 9 | SMOOTHED AIC | authKW | 168989 | 1% | 100% | 2 |
| 10 | SMOOTHED BIC | authKW | 168989 | 1% | 100% | 2 |
Web of Science journal categories |
| chi_square_rank | Category | chi_square | shrOfCwithTerm | shrOfTermInClass | termInClass |
|---|---|---|---|---|---|
| 1 | Social Sciences, Mathematical Methods | 19699 | 28% | 0% | 106 |
| 2 | Economics | 10080 | 56% | 0% | 208 |
| 3 | Statistics & Probability | 8457 | 37% | 0% | 137 |
| 4 | Mathematics, Interdisciplinary Applications | 1928 | 17% | 0% | 62 |
| 5 | Agricultural Economics & Policy | 124 | 1% | 0% | 5 |
| 6 | Computer Science, Interdisciplinary Applications | 90 | 5% | 0% | 18 |
| 7 | Business, Finance | 63 | 2% | 0% | 8 |
| 8 | Management | 49 | 3% | 0% | 11 |
| 9 | Sociology | 34 | 2% | 0% | 8 |
| 10 | Mathematical & Computational Biology | 27 | 2% | 0% | 7 |
Address terms |
| chi_square_rank | term | chi_square | shrOfCwithTerm | shrOfTermInClass | termInClass |
|---|---|---|---|---|---|
| 1 | BONN ECON BGSE | 84495 | 0% | 100% | 1 |
| 2 | ECON GEOG GI SCI | 84495 | 0% | 100% | 1 |
| 3 | EURADOM | 84495 | 0% | 100% | 1 |
| 4 | NETHERLANDS BUR ECON POLICY ANAL CPB | 84495 | 0% | 100% | 1 |
| 5 | ORSTAT OPERAT BUSINESS STAT | 84495 | 0% | 100% | 1 |
| 6 | OXFORD MARTIN OOL | 84495 | 0% | 100% | 1 |
| 7 | STAT ECONOMETR METHODS PF 49 | 84495 | 0% | 100% | 1 |
| 8 | WORKER INNOVAT | 84495 | 0% | 100% | 1 |
| 9 | ORSTAT | 43443 | 2% | 9% | 6 |
| 10 | CELLULAR MOL HAEMATOL UNIT | 42246 | 0% | 50% | 1 |
Journals |
| chi_square_rank | term | chi_square | shrOfCwithTerm | shrOfTermInClass | termInClass |
|---|---|---|---|---|---|
| 1 | JOURNAL OF APPLIED ECONOMETRICS | 17204 | 4% | 1% | 16 |
| 2 | JOURNAL OF ECONOMETRICS | 16990 | 7% | 1% | 27 |
| 3 | ECONOMETRIC THEORY | 10727 | 3% | 1% | 13 |
| 4 | OXFORD BULLETIN OF ECONOMICS AND STATISTICS | 5444 | 2% | 1% | 9 |
| 5 | JOURNAL OF ECONOMIC SURVEYS | 5197 | 2% | 1% | 6 |
| 6 | ECONOMETRIC REVIEWS | 5008 | 1% | 1% | 5 |
| 7 | ECONOMETRICS JOURNAL | 4544 | 1% | 1% | 4 |
| 8 | STATA JOURNAL | 4346 | 1% | 1% | 5 |
| 9 | EMPIRICAL ECONOMICS | 3462 | 2% | 1% | 7 |
| 10 | STATISTICA SINICA | 2928 | 2% | 0% | 8 |
Author Key Words |
Core articles |
The table includes core articles in the class. The following variables is taken into account for the relevance score of an article in a cluster c: (1) Number of references referring to publications in the class. (2) Share of total number of active references referring to publications in the class. (3) Age of the article. New articles get higher score than old articles. (4) Citation rate, normalized to year. |
Classes with closest relation at Level 1 |